Toronto-3D
Toronto-3D is a large-scale urban outdoor point cloud dataset acquired by an MLS system in Toronto, Canada for semantic segmentation. This dataset covers approximately 1 km of road and consists of about 78.3 million points. Point clouds has 10 attributes and classified in 8 labelled object classes. There is a data preparation tip to handle UTM coordinates to avoid problems. There are also some known issues.
Details on the dataset can be found at CVPRW2020. Revisions on the labels will lead to different results from the published paper, and updated results will be updated here.
Dataset can be downloaded at OneDrive or 百度网盘(提取码:aewp).
Check Changelog for changes.
Toronto-3D belongs to Mobile Sensing and Geodata Science Lab, University of Waterloo.
Teledyne Optech is acknowledged for providing mobile LiDAR point cloud data collected by Maverick. Thanks Jing Du and Dr. Guorong Cai from Jimei University for point cloud labelling.
Thanks Intel ISL for including our dataset in the Open3D-ML 3D Machine Learning module.
If you have questions, or any suggestions to help us improve the dataset, please contact Weikai Tan.
Semantic segmentation results with point coordinates
More results to be added
| Method | OA | mIoU | Road | Road marking | Natural | Building | Utility line | Pole | Car | Fence |
|---|---|---|---|---|---|---|---|---|---|---|
| PointNet++ | 84.88% | 41.81% | 89.27% | 0.00% | 69.06% | 54.16% | 43.78% | 23.30% | 52.00% | 2.95% |
| PointNet++ * | 91.66% | 58.01% | 92.71% | 7.68% | 84.30% | 81.83% | 67.44% | 63.30% | 60.92% | 5.92% |
| PointNet++ MSG | 92.56% | 59.47% | 92.90% | 0.00% | 86.13% | 82.15% | 60.96% | 62.81% | 76.41% | 14.43% |
| DGCNN | 94.24% | 61.79% | 93.88% | 0.00% | 91.25% | 80.39% | 62.40% | 62.32% | 88.26% | 15.81% |
| KPFCNN | 95.39% | 69.11% | 94.62% | 0.06% | 96.07% | 91.51% | 87.68% | 81.56% | 85.66% | 15.72% |
| MS-PCNN | 90.03% | 65.89% | 93.84% | 3.83% | 93.46% | 82.59% | 67.80% | 71.95% | 91.12% | 22.50% |
| TGNet | 94.08% | 61.34% | 93.54% | 0.00% | 90.83% | 81.57% | 65.26% | 62.98% | 88.73% | 7.85% |
| MS-TGNet | 95.71% | 70.50% | 94.41% | 17.19% | 95.72% | 88.83% | 76.01% | 73.97% | 94.24% | 23.64% |
| RandLA-Net | 88.43% | 74.27% | 87.43% | 22.04% | 96.36% | 92.69% | 85.93% | 75.50% | 86.60% | 47.64% |
* use same radii and k as TGNet
Point cloud attributes
- XYZ
- RGB
- Intensity
- GPS time
- Scan angle rank
Classes
- Road (label 1)
- Road marking (label 2)
- Natural (label 3)
- Building (label 4)
- Utility line (label 5)
- Pole (label 6)
- Car (label 7)
- Fence (label 8)
- unclassified (label 0)
Data preparation tip
The XY coordinates are stored in UTM format. The Y coordinate may exceed decimal digits in float type commonly used in point cloud processing algorithms. Directly read and process the coordinates could result in loss of detail and wrong geometric features.
I set a UTM_OFFSET = [627285, 4841948, 0] to subtract from the raw coordinates. You may use any other numbers to reduce number of digits.
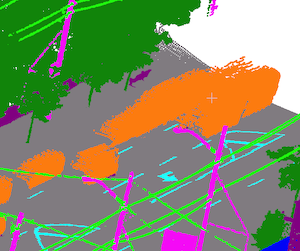
Example of potential issues during grid_subsampling operation used in KPConv and RandLA-Net: both subsampled to grid size 6cm
| without offset | with offset |
|---|---|
 |
 |
Known issues
- Point RGB assignments on taller vehicles.
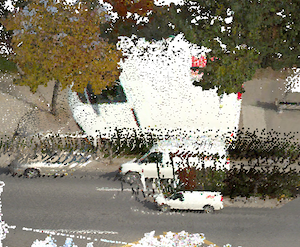
- Point RGB artifact assignments on moving vehicles.
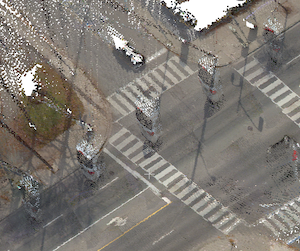
- Point acquisition on moving vehicles.