Pydemic
A simple agent-based model of a pandemic.
This is used to teach basic principles of object-oriented programming to master students.
It is not at all optimized for performance and does not have any predictive skill.
Based on an original idea by Georg Wohlfahrt.
Rules
We are simulating a square 2-dimensional (nx x nx pixel) domain which is populated by a maximum number of agents (na), i.e. human individuals. The initial position of the agents on the domain is determined with a pseudo-random number generator. Two or more agents may populate the same pixel.
The simulation runs to a maximum of nt time steps. During every time step each agent may move a maximum number of pixels in the horizontal (x) and vertical (y) direction, as determined by the movemax parameter. If movemax = 2, this means that agents may move between -2 and +2 pixels in the x/y-direction – the actual number of moves within these limits is again determined with the random number generator.
If the random moves would cause an agent to leave the domain, the agent is perfectly “reflected” into the domain, i.e. if a random move would bring an agent to the position nx + 2, the position is corrected to nx – 2.
At the start of the simulation, a number n_initial_infected of randomly selected agents carries the virus.
If two or more agents meet on the same pixel and at least one of them is infected there is a certain probability (probability_of_infection) that non-infected, non-immune agents become infected. This dice roll is repeated for each infected agent at this location.
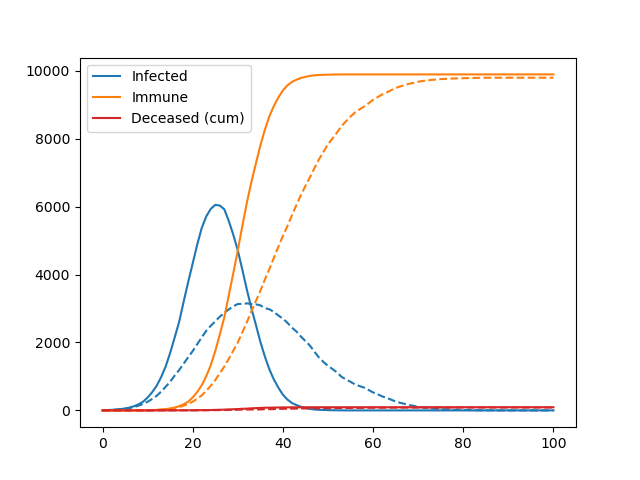
If infected, agents remain infectious until they recover (time_until_recovery). At the end of the infection period, there is also some probability that agents do not recover, but instead decease (mortality_rate), which reduces the total number of agents on the domain. After recovery, the past infection conveys immunity from another infection.
Potential improvements
There are many. See exercises on the topic.
Getting started
and run pydemic.py in the terminal or in the ipython interpreter.
TODO Fabien
- Write tests.
- Add a visualisation of the spatial domain (with density plots or similar).


