Roentgen
The idea behind Röntgen project is to have a possibility to display any map feature represented by OpenStreetMap data tags by means of colors, shapes, and icons.
Röntgen is primarily created for OpenStreetMap contributors. Suppose, you spent time adding colors for building walls, benches and shelters for bus stops but they are not represented on the standard tile layer. Röntgen helps to display all changes you made.
Nevertheless, Röntgen map generator can generate precise but messy maps for OSM contributors as well as pretty and clean maps for OSM users.
Usage
To get SVG map, just run
python roentgen.py -b <lon1>,<lat1>,<lon2>,<lat2>
(e.g. python roentgen.py -b 2.284,48.86,2.29,48.865). It will automatically download OSM data and write output map to map.svg. For more options see Map generation.
Map features
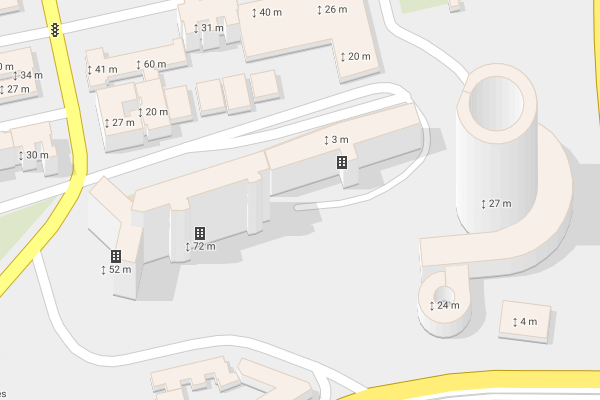
Building levels
Simple shapes for walls and shade in proportion to building:levels value.
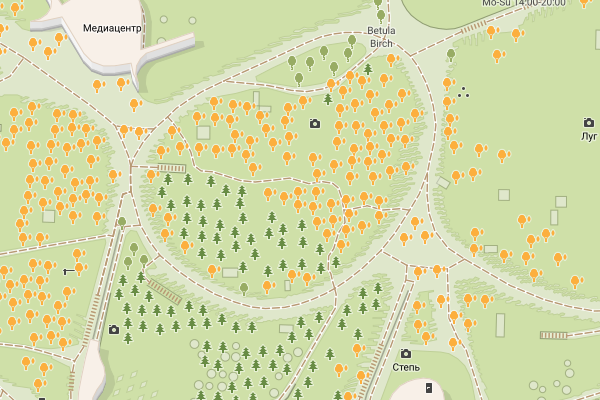
Trees
Visualization of tree leaf types (broadleaved or needleleaved) and genus or taxon by means of icon shapes and leaf cycles (deciduous or evergreen) by means of color.
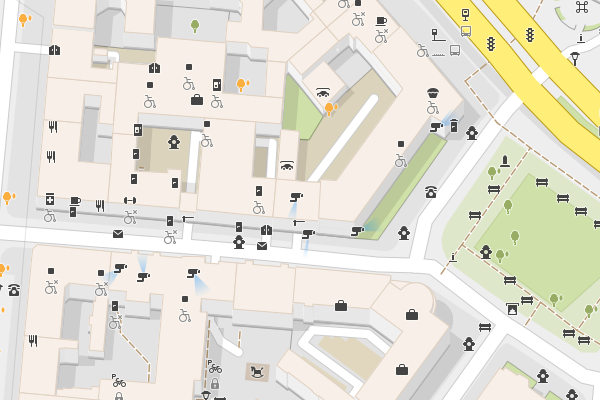
Viewpoint and camera direction
Visualize direction tag for tourism=viewpoint and camera:direction for man_made=surveillance.
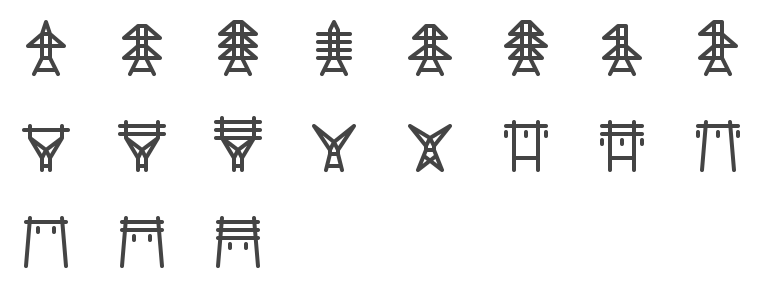
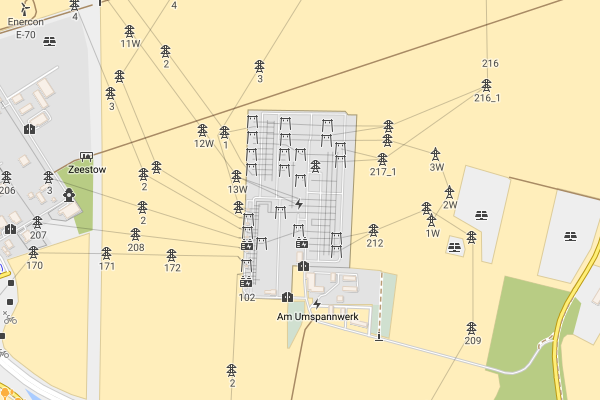
Power tower design
Visualize design values used with power=tower tag.
Emergency

Japanese map symbols
There are special symbols appearing on Japanese maps.

Icon set
If tag is drawable it is displayed using icon combination and colors. All icons are under CC BY license. So, do whatever you want but give appropriate credit. Icon set is heavily inspired by Maki, Osmic, and Temaki icon sets.
Feel free to request new icons via issues for whatever you want to see on the map. No matter how frequently the tag is used in OpenStreetMap since final goal is to cover all tags. However, common used tags have priority, other things being equal.
Draw icon grid: python roentgen.py grid.
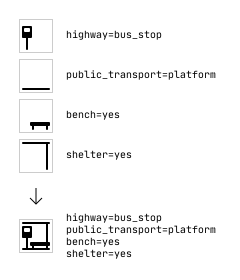
Icon combination
Some icons can be combined into new icons.
Map styles
All tags style
Options: --show-missing-tags --overlap 0.
Display as many OpenStreetMap data tags on the map as possible.
Pretty style
Options: --draw-captions main --level overground.
Display only not overlapping icons and main captions.
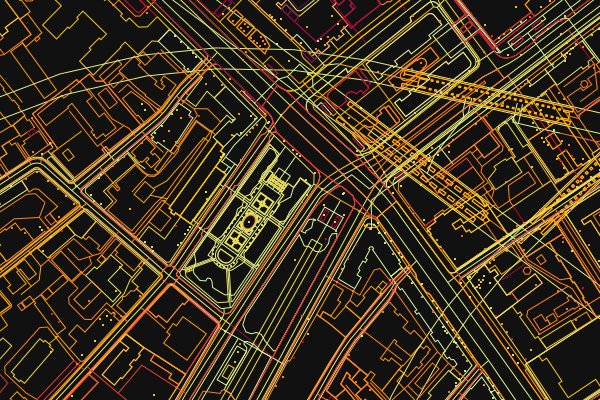
Creation time mode
Visualize element creation time with --mode time.
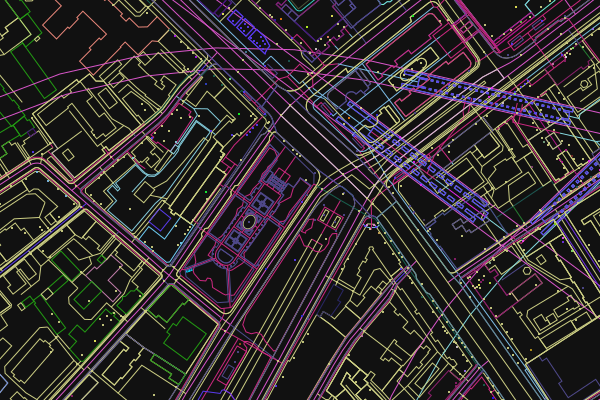
Author mode
Every way and node displayed with the random color picked for each author with --mode user-coloring.
Map generation
Requirements
- Python (at least 3.8).
Installation
pip install -r requirements.txt
Script running
There are simple Python renderer that generates SVG map from OpenStreetMap data. You can run it using:
python roentgen.py \
    -b ${LONGITUDE_1},${LATITUDE_1},${LONGITUDE_2},${LATITUDE_2} \
    -o ${OUTPUT_FILE_NAME} \
    -s ${OSM_ZOOM_LEVEL}
Example:
python roentgen.py -b 2.284,48.86,2.29,48.865
Main arguments
Required
--boundary-boxor-b: boundary box to draw. Value:<longitude 1>,<latitude 1>,<longitude 2>,<latitude 2>. Use space before first-to escape negative values.
Optional
--scaleor-s: OSM zoom level. Default is 18.-o: path to output SVG file name. Default ismap.svg.-i: path to input XML file name. If this argument is not set, XML file will be downloaded through OpenStreetMap API.
Check all arguments with python roentgen.py --help.


