Academic-Inkscape
Academic Inkscape: Extensions for figure resizing and editing
This repository contains several Inkscape extensions designed for editing plots.
- Scale Plots: Changes the size or aspect ratio of a plot without modifying its text and ticks. Especially useful for assembling multi-panel figures.
- Flatten Plots: A utility that eliminates much of the structure generated by common vector graphics plotting programs. Makes editing much easier.
- The Homogenizer: Quickly sets uniform fonts, font sizes, and stroke widths in a selection.
- The Auto-Exporter: A program that will automatically export your SVG files to various formats and keep them updated.
- Combine by Color: An extension that fuses paths of the same color and style together into a single path. Handy for speeding up operations on plots with thousands of similar elements, like markers.
All were written by David Burghoff at the University of Notre Dame. If you find it useful, tell your collegaues!
Installation
You must have the latest release version of Inkscape (1.1), and the extensions should be installed using the instructions provided here. Download all of these files, then copy them into the directory listed at Edit > Preferences > System: User extensions. After a restart of Inkscape, the group extensions will be available under Extensions > Academic.
Scale Plots
When dealing with vector graphics generated by plotting environments like Matlab and Matplotlib, resizing plots after the plot has been generated can be difficult. Generally, one wants to resize the lines and data of a plot while leaving text, ticks, and stroke widths unaffected. This is best done in the original program, but precludes quick modification.
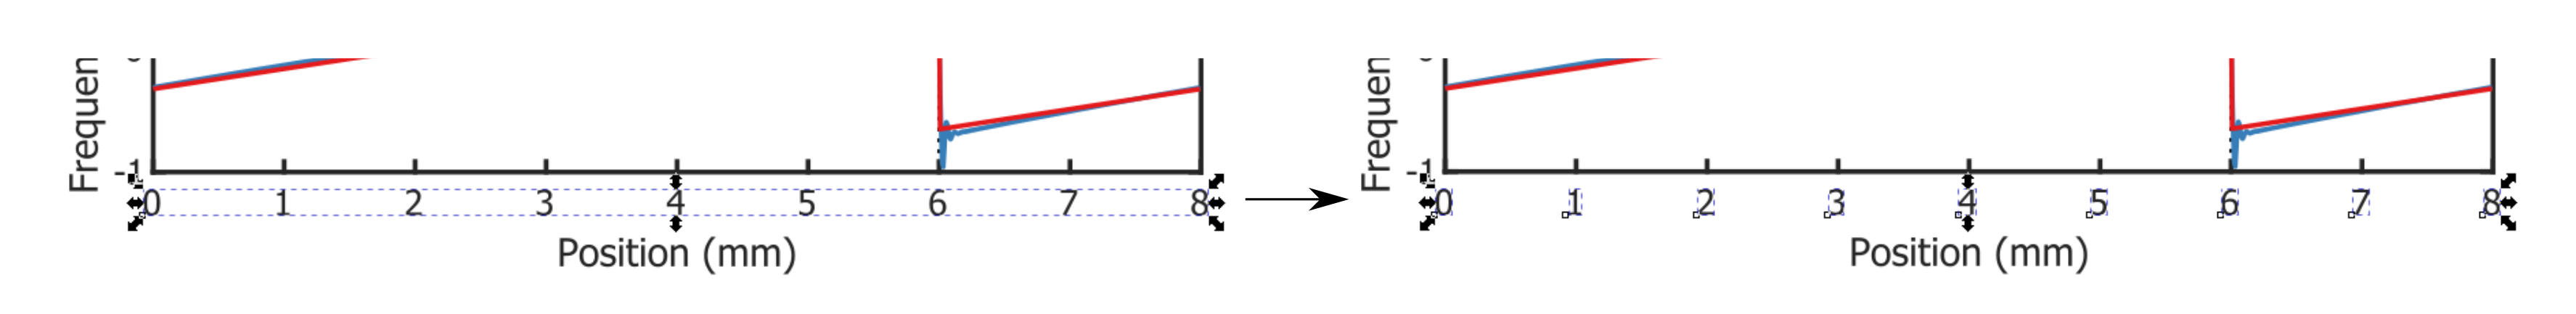
For most plots, Scale Plots generates acceptable scalings with little effort. Lines and data are scaled while text and ticks are merely repositioned. The extension attempts to maintain the distance between axes and labels/tick labels by assigning a plot area—a bounding box that is calculated from the largest horizontal and vertical lines. Anything outside is assumed to be a label. (If your plot's axes do not have lines, temporarily add a box to define a plot area.)

To use:
- Run Flatten Plots on your plot to remove structure generated by the PDF/EPS/SVG exporting process.
- Place any objects that you wish to remain unscaled in a group.
- Select the elements of your plot and run Scale Plots.
Scale Plots has two modes. In Scaling Mode, the plot is scaled by a constant factor. In Matching Mode, the plot area is made to match the size of the first object you select. This can be convenient when assembling subfigures, as it allows you to match the size of one plot to another plot or to a template rectangle.
Advanced options
- If "Auto tick correct" is enabled, the extension assumes that any small horizontal or vertical lines near the edges of the plot area are ticks, and automatically leaves them unscaled.
- If a layer name or group ID is put into the "Scale-free elements" option, any elements on that layer will remain unscaled. This is basically the same thing as putting an object in a group, but can be easier if there are many such objects (e.g, if your plot has markers).
Flatten Plots
Flatten Plots is a useful utility that eliminates many of the difficulties that arise when plots are exported from common plotting programs.
- Deep ungroup: The Scale Plots utility uses grouping to determine when objects are to be kept together, so a deep ungroup is typically needed to remove any existing groupings initially. It also unlinks any clones.
- Apply text fixes: Applies a series of fixes to text described below (particularly useful for PDF/EPS text).
- Remove white rectangles: Removes any rectangles that have white fill and no stroke. Mostly for removing a plot's background.
Text fixes
- Split distant text and lines: Depending on the renderer, it is often the case that the PDF/EPS printing process generates text implemented as a single text object. For example, all of the x-axis ticks might be one object, all of the y-axis ticks might be another, and the title and labels may be another. Internally, each letter is positioned independently. This looks fine, but causes issues when trying to scale or do anything nontrivial.
- Merge nearby text: The opposite can also occur: text that should be one line is split into multiple objects. This option reverses that.
- Remove manual kerning: Text in PDFs is often 'kerned'—its letters are positioned individually, so if you try to edit it you will get strange results. This option reverses that, although the tradeoff is that text may be slightly repositioned.
- Merge superscripts and subscripts: Detect likely subscripts and superscripts, replacing them with native SVG versions.
- Replace missing fonts: Useful for imported documents whose original fonts are not installed on the current machine.
The Homogenizer
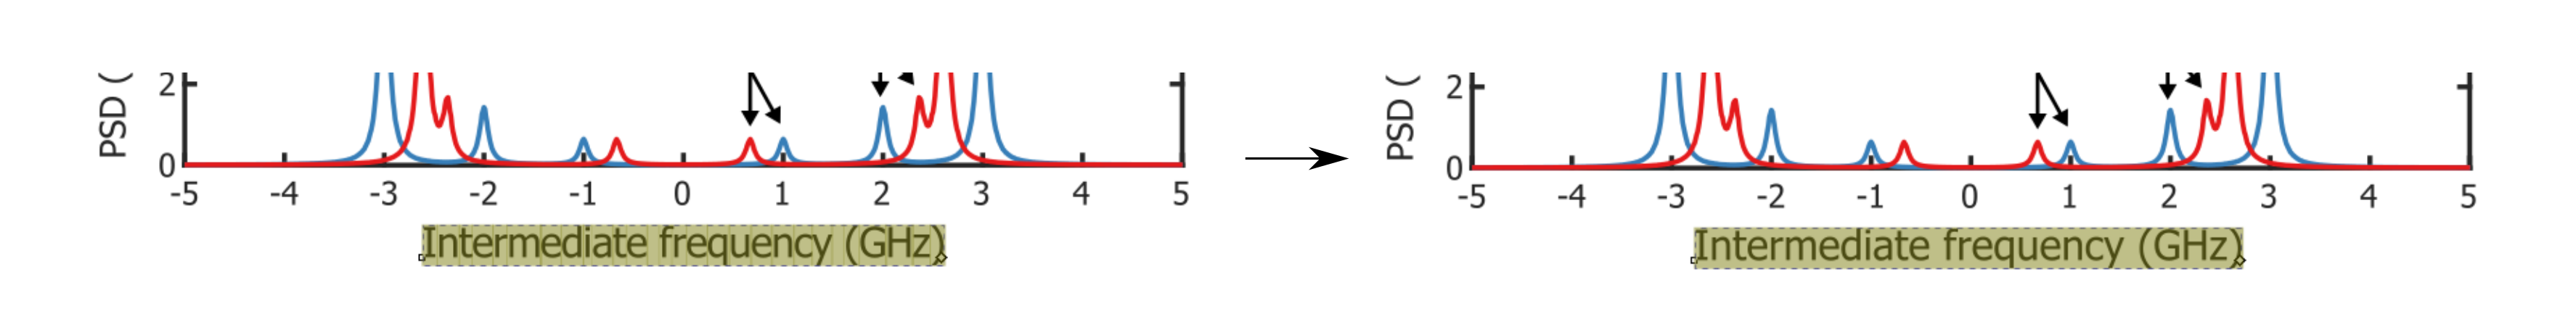
The Homogenizer is a utility that does what its name implies: it will set all of the fonts, font sizes, and stroke widths in a selection to the same value. This is most useful when assembling sub-figures, as it allows you to ensure that the whole figure has a uniform look.
Auto-Exporter
The Auto-Exporter is not technically an extension, it is a Python script meant to be run in the background as a service. If you frequently export your figures to other formats, you know that updating them whenever you change your figure is a nuisance. This program does it automatically: you specify a directory that the program monitors, and whenever any SVGs are changed, it automatically converts them to the formats you specify. Just select (a) the location where the Inkscape binary is installed, (b) what directory you would like it to watch, and (c) where you would like it to put the exports.
It is currently implemented as a Python script and requires at least Python 3.7. If someone would like to package it into a nice GUI and create executables, let me know.
Combine by Color
If you have used Inkscape for editing plots with thousands of elements, you have probably found that it behaves sluggishly. Often, this can be solved by combining paths of the same color together into a single path, but when your plot has multiple curves then you have to select the elements belonging to different curves separately. Combine by Color simplifies this, automatically fusing paths of the same style together. Not only does this tend to improve responsiveness, but typically it will also reduce the file size of the output.
Note: If you subsequently run Scale Plots on a path generated by Combine by Color, Scale Plots can treat the merged sub-paths independently—just specify the path ID as a Scale-free element.


