The World Bank Data in Python
This is an implementation of the World Bank API v2 in Python. Use this package to explore the World Development Indicators published by the World Bank.
Quick tutorial
Installation
Install or update the World Bank Data python package with
pip install world_bank_data --upgrade
Get the list of sources, topics, countries, regions
import pandas as pd
import world_bank_data as wb
pd.set_option('display.max_rows', 6)
The list of topics is available with
wb.get_topics()
Sources are returned by
wb.get_sources()
And finally, the list of countries is accessible with
wb.get_countries()
In addition, give a try to
get_regionsget_incomelevelsget_lendingtypes
to retrieve more information about country classifiers.
Get the list of indicators
This is done with the get_indicators function. You may query only the indicators for a specific source or topic as below. If you input no arguments, the get_indicator function will return the description of all the 16,000+ indicators.
wb.get_indicators(topic=3, source=2) # topic and source id are from get_topics/get_sources
Requesting all indicators may take a few seconds, but no worries, the result is cached, so next time this will be instantaneous.
Searching for one country or indicator
Use the functions search_countries, search_source, search_indicators. Or, if you want to search in a existing dataframe, simply use search.
wb.search_indicators('mathematics')
Get the values of an indicator
The function get_series returns the value of a single indicator. The World Bank API accepts quite a few arguments, including:
mrv, integer: one or more most recent valuesdate, string: either one year, or two years separated with a colon, like '2010:2018'gapfill, string: 'Y' or 'N' (the default): forward fills missing values.
For instance, the call below returns the most recent estimate for the World Population:
wb.get_series('SP.POP.TOTL', mrv=1)
The result above has a 3-dimensional index. Use the argument simplify_index to ignore the dimensions that take a single value (here: year and series). Also, use the argument id_or_value='id' if you prefer your data to be indexed by the codes rather than labels:
wb.get_series('SP.POP.TOTL', date='2016', id_or_value='id', simplify_index=True)
Ready for an interative tutorial?
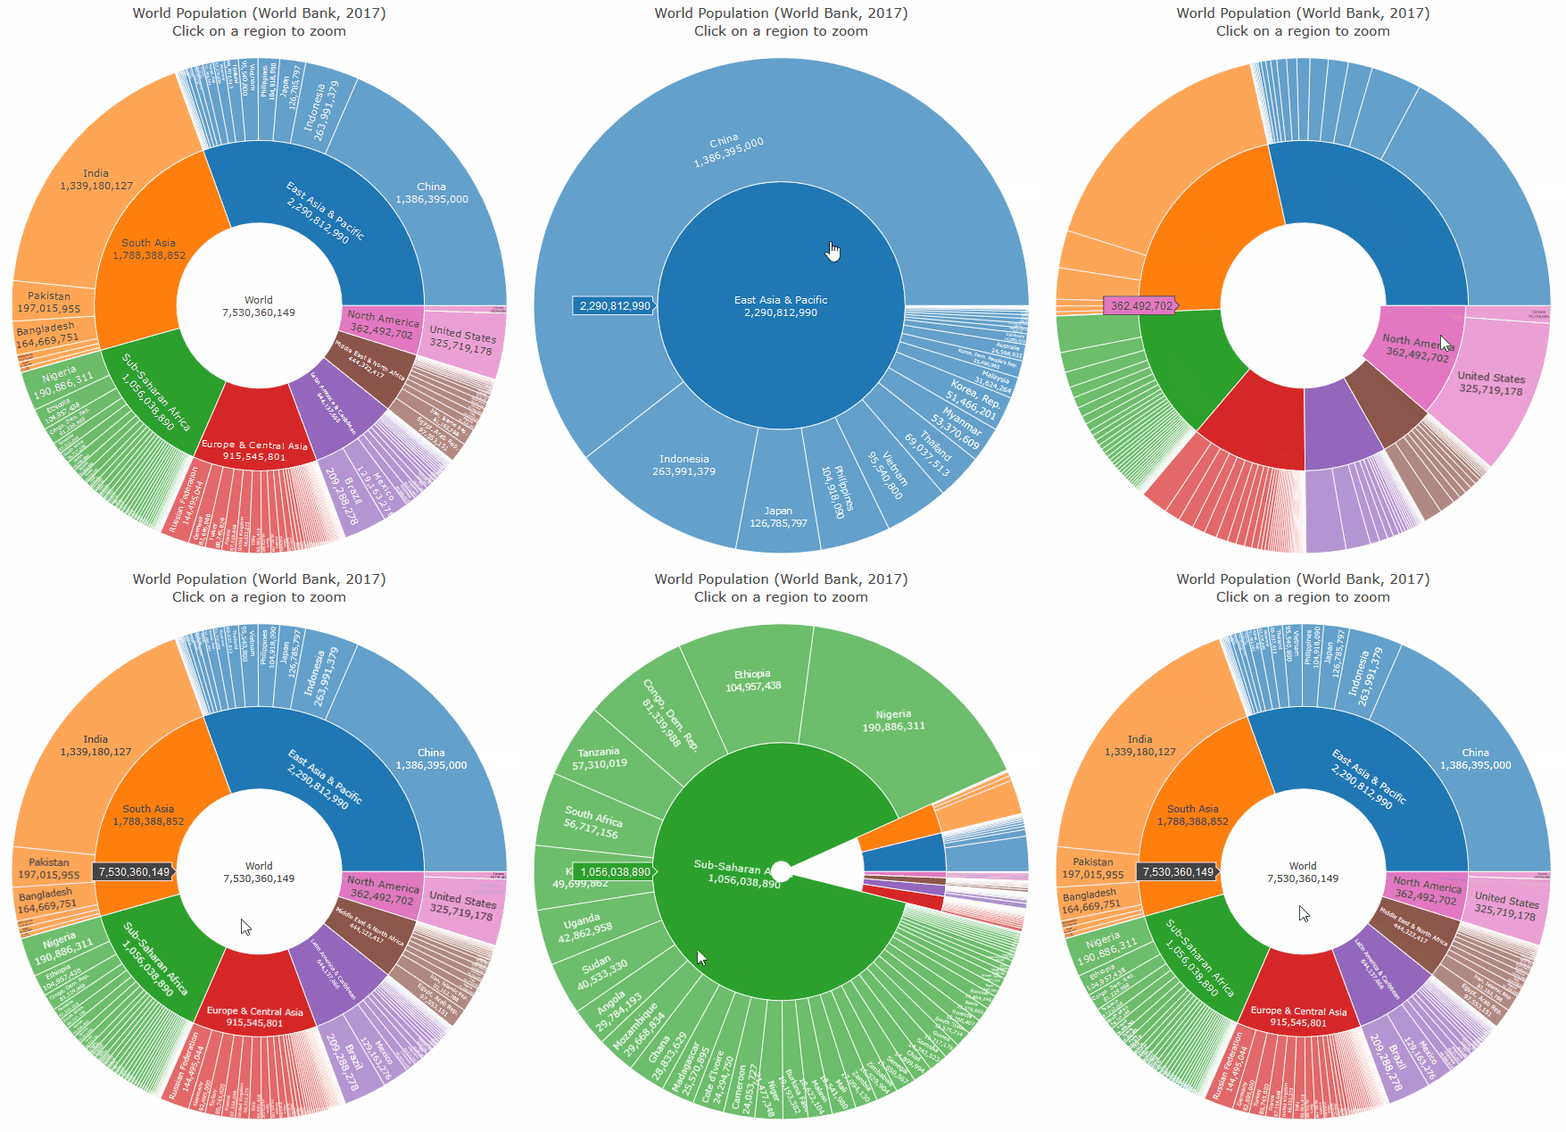
Go to our Binder and run either this README, or our other tutorial with the code required to produce this plot of the World Population:


