Falcon
Interactive Visual Analysis for Big Data.
Crossfilter millions of records without latencies. This project is work in progress and not documented yet. Please get in touch if you have questions.
The largest experiments we have done so far is 10M flights in the browser and ~180M flights or ~1.2B stars when connected to MapD.
Demos
- 1M flights in the browser: https://uwdata.github.io/falcon/flights/
- 7M flights in MapD: https://uwdata.github.io/falcon/flights-mapd/
- 500k weather records: https://uwdata.github.io/falcon/weather/
Usage
Install with yarn add falcon-vis. You can use two query engines. First ArrowDB reading data from Apache Arrow. This engine works completely in the browser and scales up to ten million rows. Second, MapDDB, which connects to MapD. The indexes are created as ndarrays. Check out the examples to see how to set up an app with your own data. More documentation will follow.
Features
Zoom
You can zoom histograms. Falcon automatically re-bins the data.
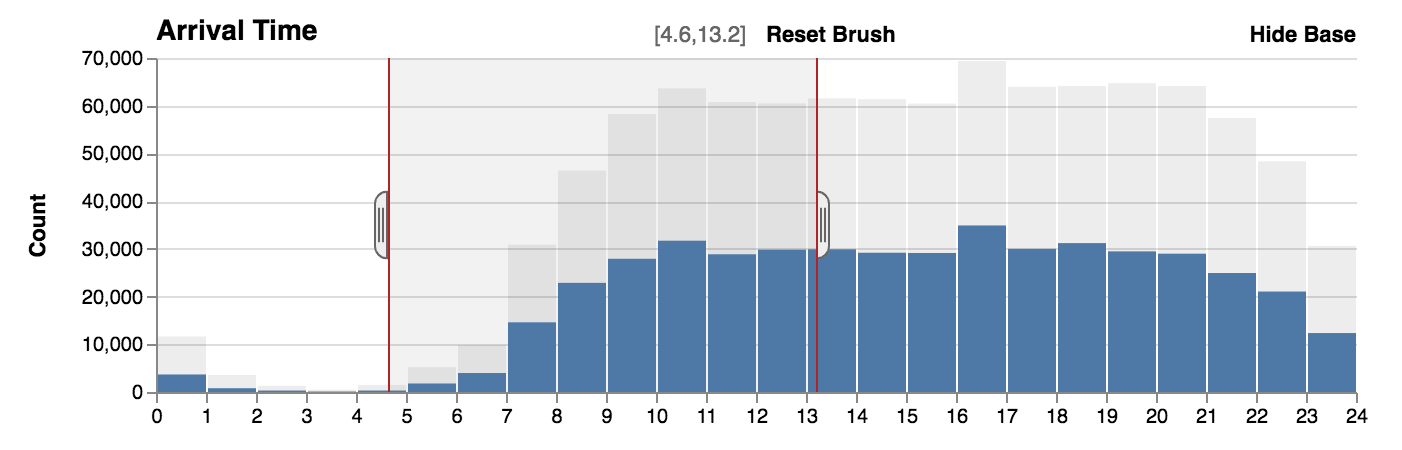
Show and hide base
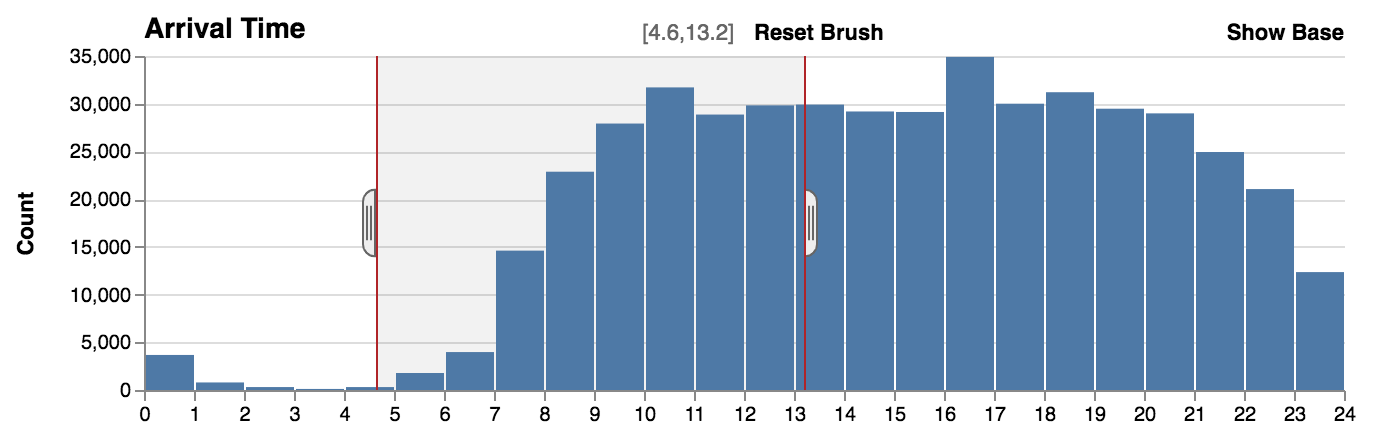
The base data, which are the original counts without filters, can be displayed behind the filtered counts to provide context. Hiding the base shows the relative distribution of the data.
With base.
Without base.
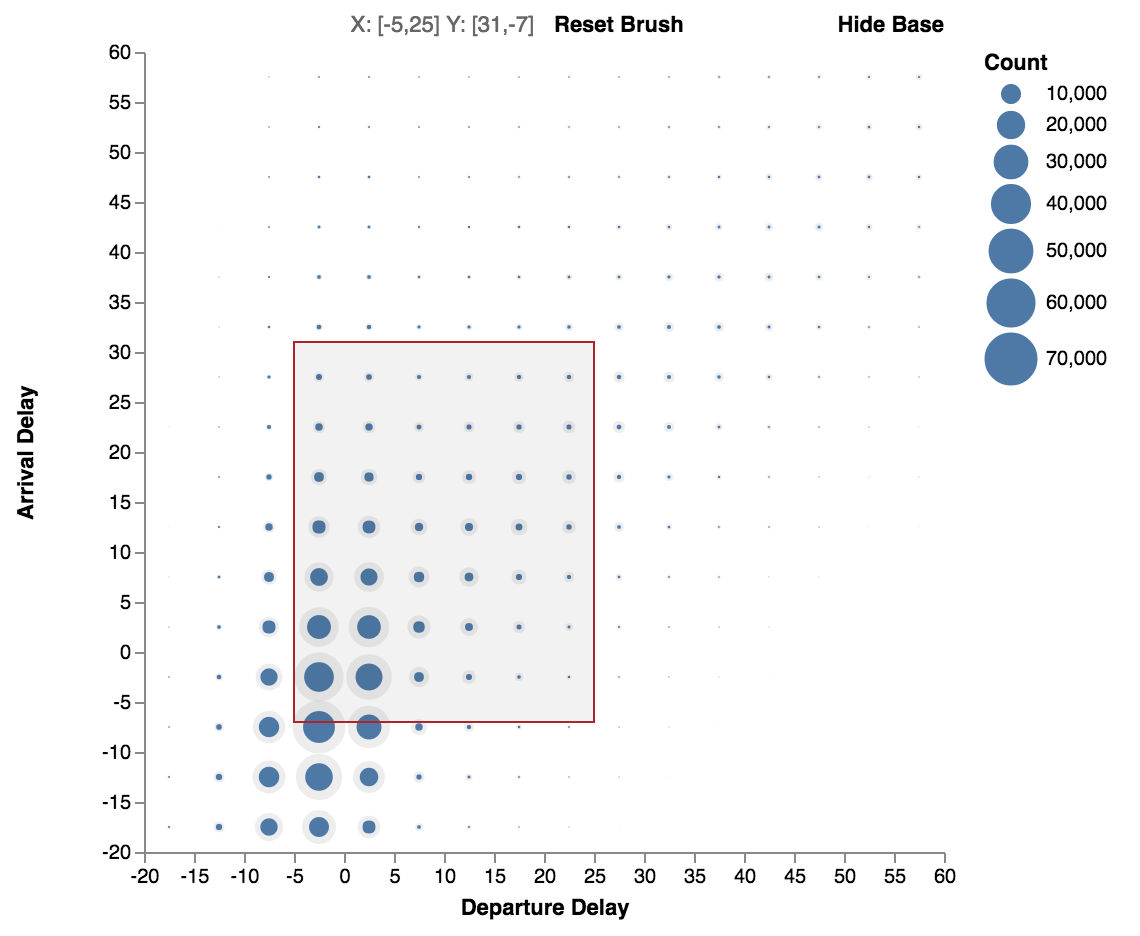
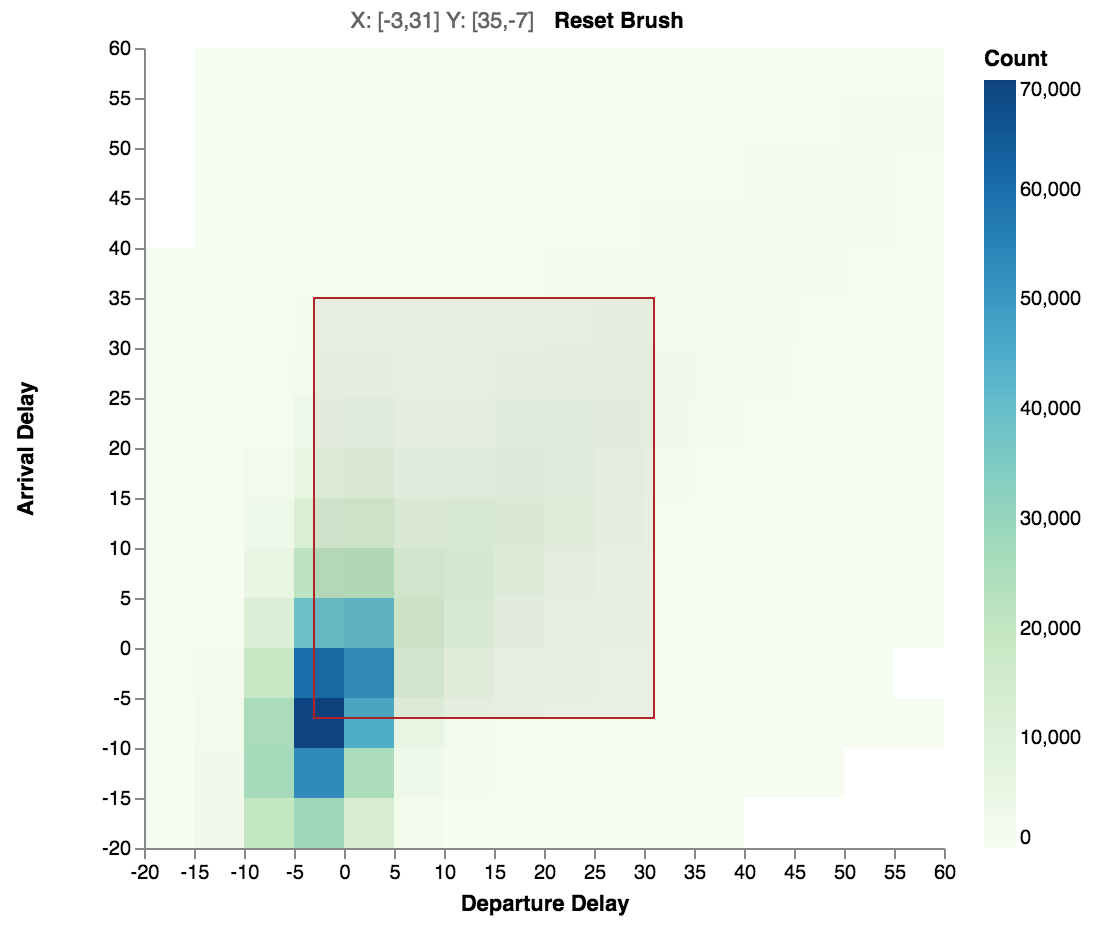
Circles or Color Heatmap
Heatmap with circles (default). Can show the base (data without filters).
Heatmap with colored cells.
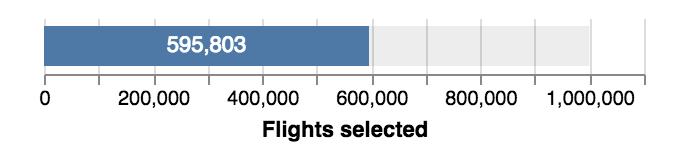
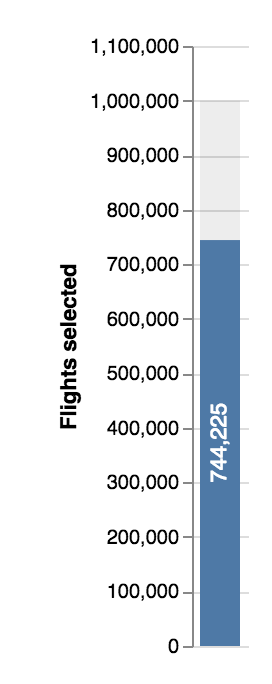
Vertical bar, horizontal bar, or text for counts
Horizontal bar.
Vertical bar.
Text only.
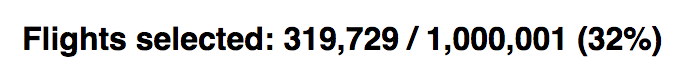
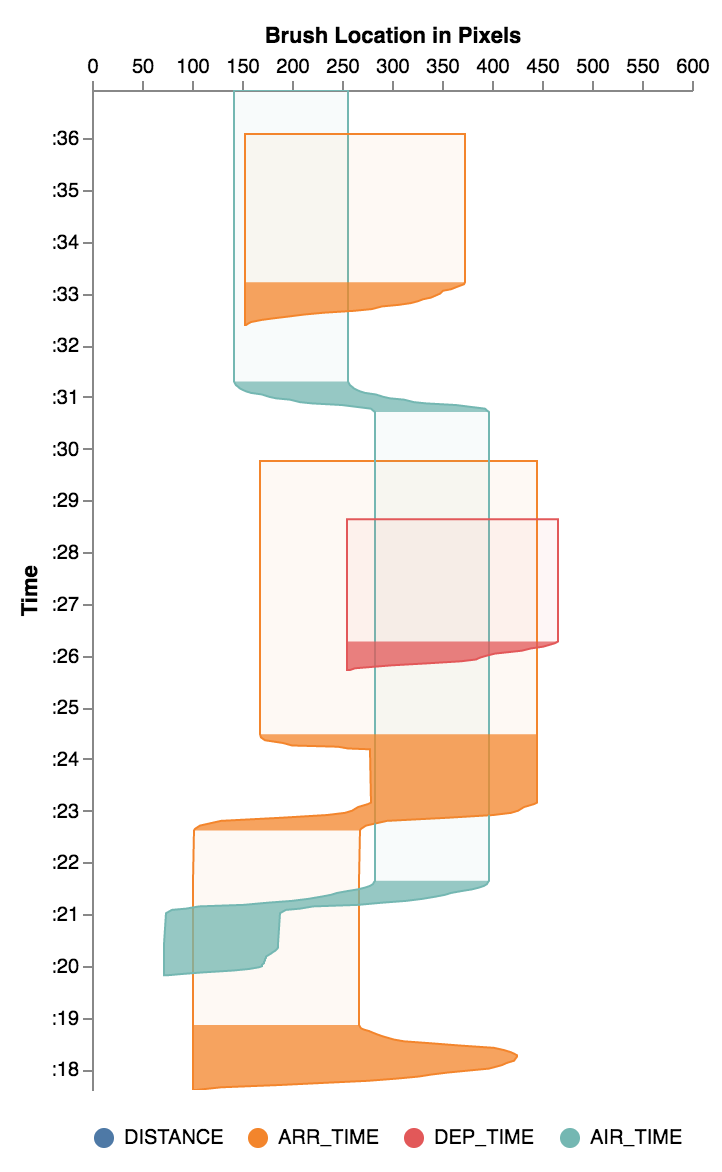
Timeline visualization
You can visualize the timeline of brush interactions in Falcon.
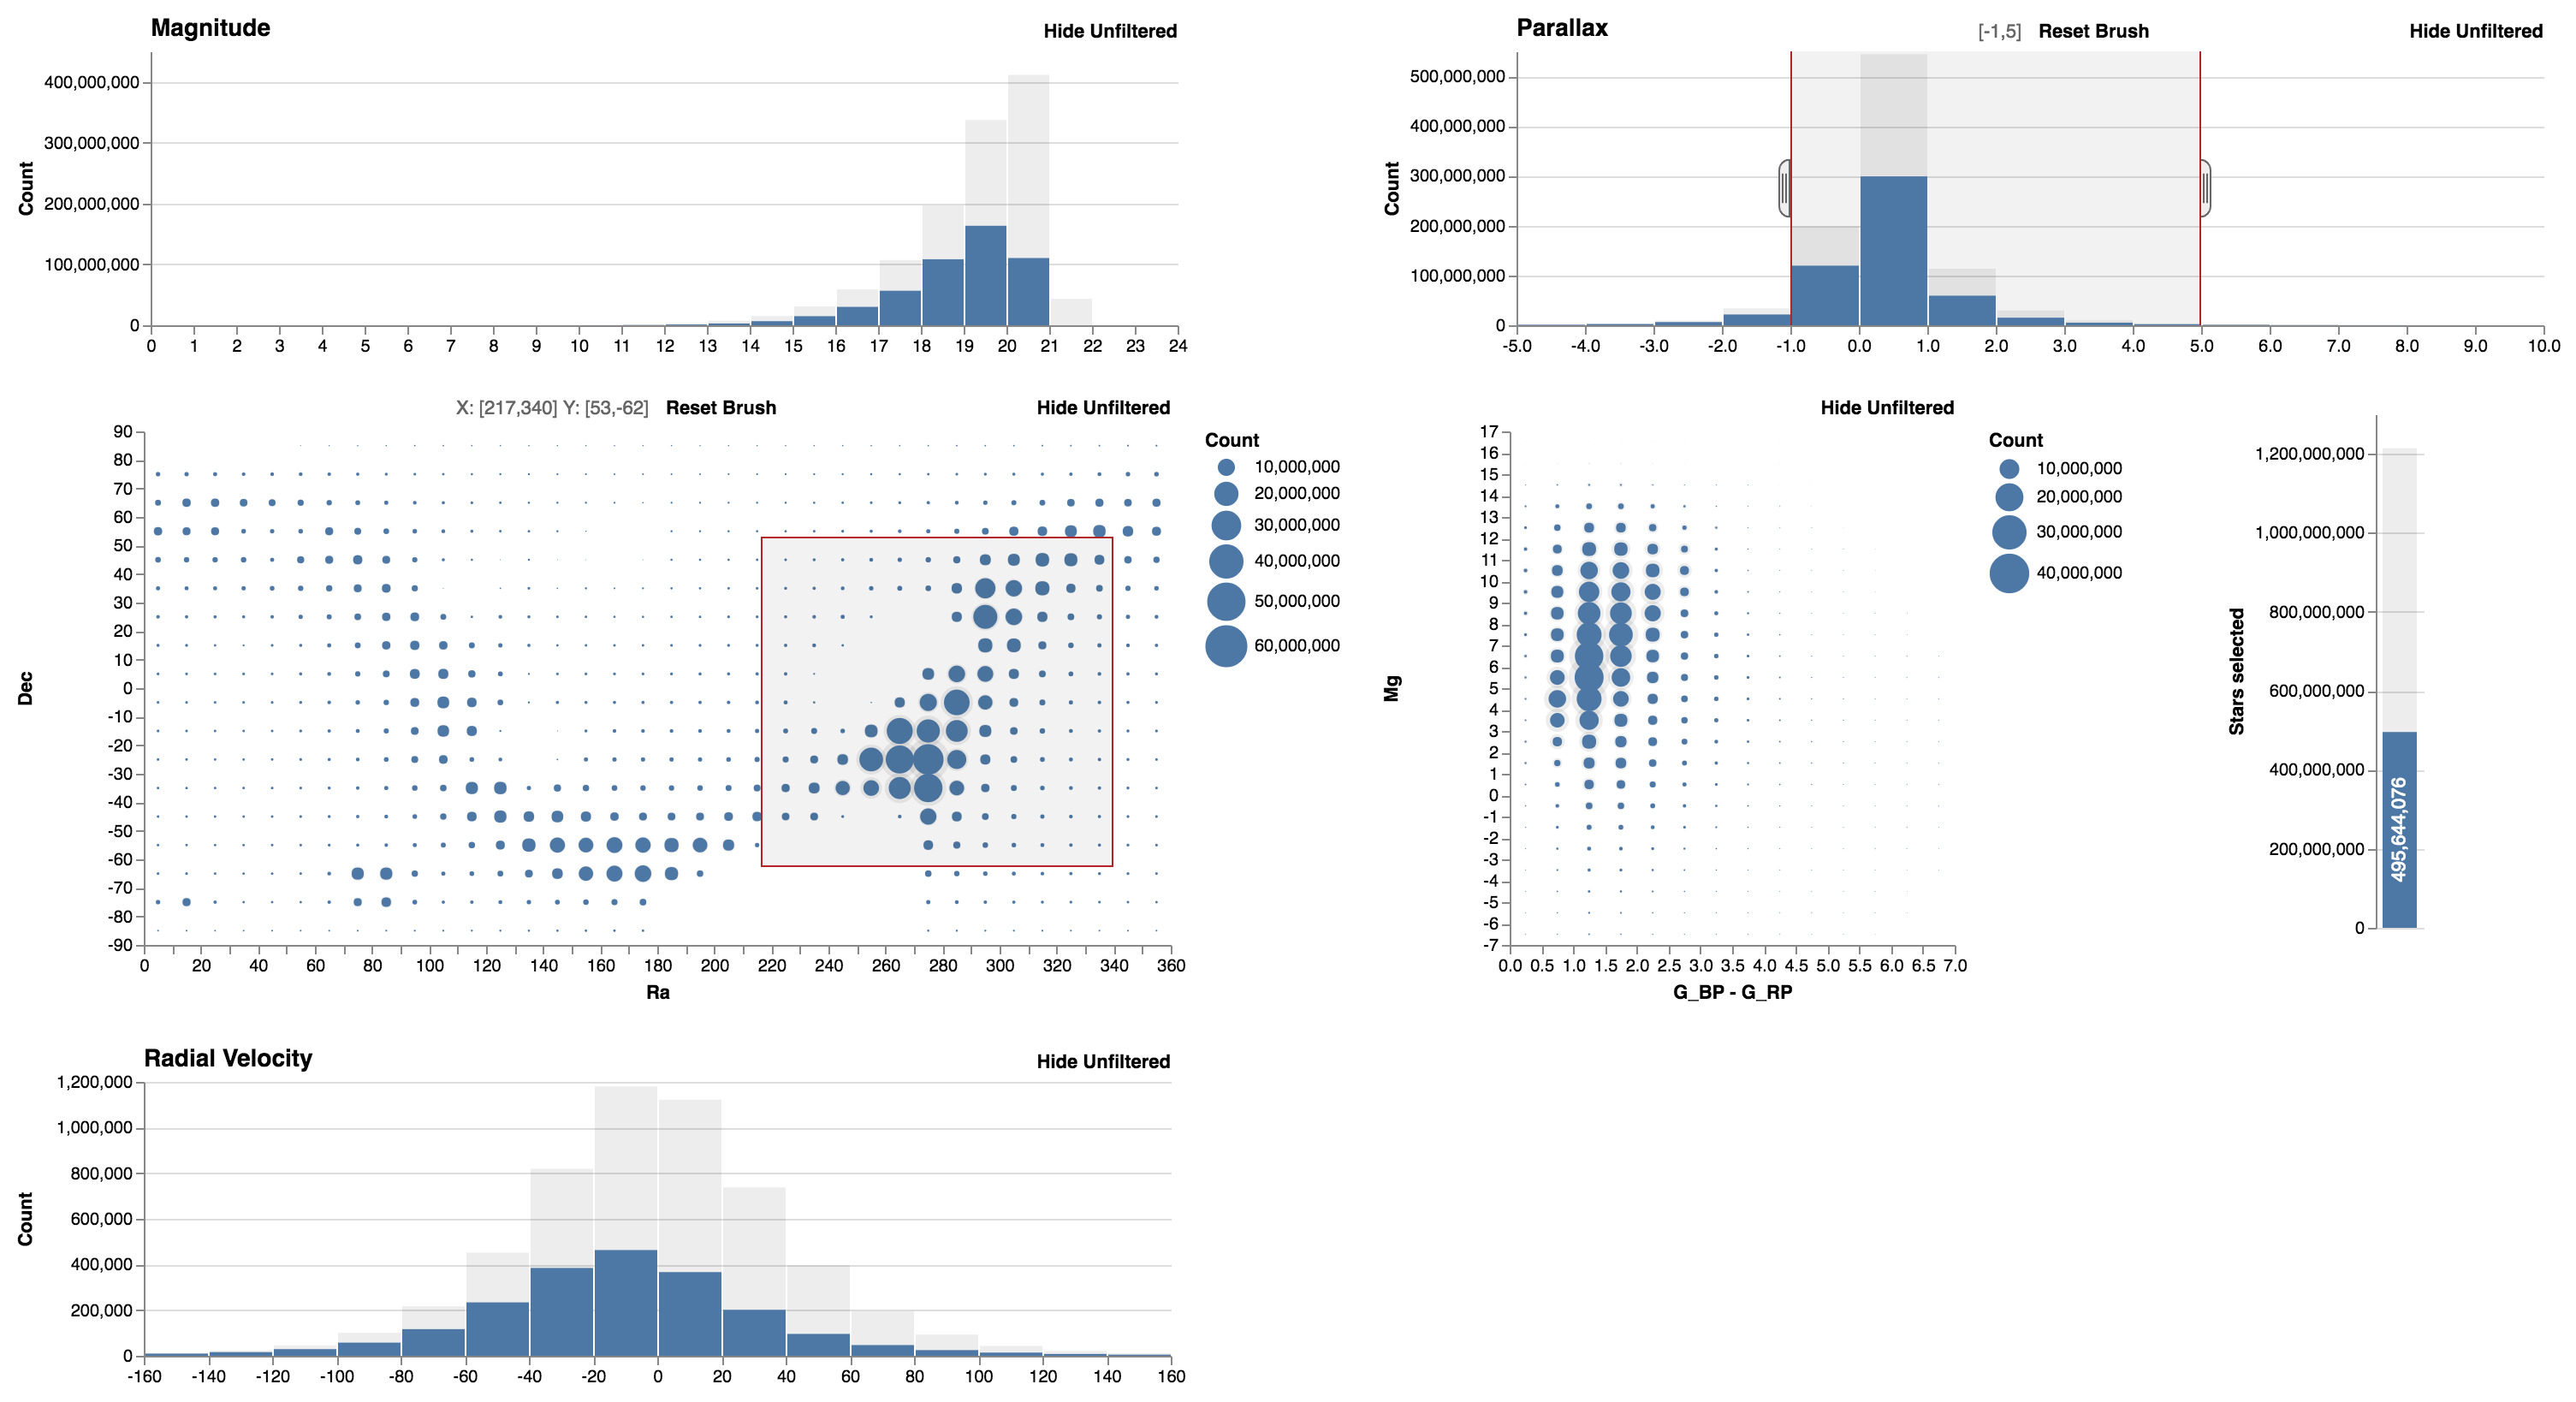
Falcon with 1.2 billion stars from the GAIA dataset
The GAIA spacecraft measured the positions and distances of stars with unprecedented precision. It collected about 1 billion objects, mainly stars, but also planets, comets, asteroids and quasars among others. Below, we show the dataset loaded in Falcon (with MapD).
Developers
Install the dependencies with yarn. Then run yarn start to start the flight demo with in memory data. Have a look at the other script commands in package.json.


