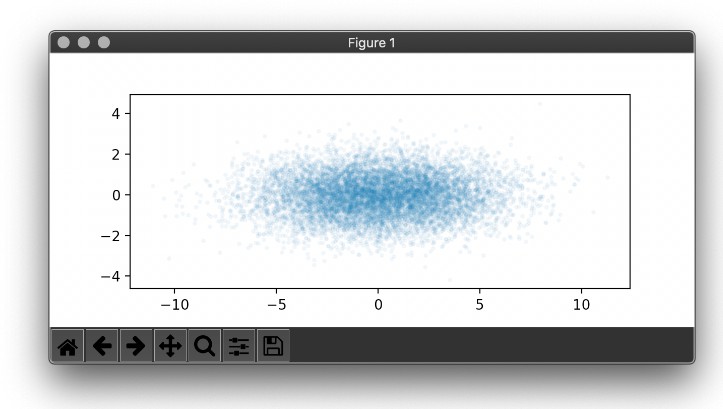
Monochromatic colorscheme for matplotlib with opinionated sensible default
If you need a simple monochromatic colorscheme for your matplotlib figures, this is probably for you.
No fancy colors and unnecessary distractions.
To install, simply run this on terminal:
pip install monoplt
or if you want the latest development version, run this instead:
pip install git+https://github.com/ariaghora/monoplt
Usage
from monoplt import apply_monochrome_style, generate_pattern_cycler
import matplotlib.pyplot as plt
apply_monochrome_style(plt)
Example: line plot
plt.figure(figsize=(7,5))
for i in range(1,5):
    plt.plot(np.arange(10), np.arange(10)*i, label=i)
plt.xlabel("$x$")
plt.ylabel("$f(x)$")
plt.legend(facecolor='white', framealpha=1)
plt.show()
Example: bar plot
For plots involving fill colors (e.g., bar plot, histogram, etc.), this will give you some trouble since all colors are black, and no distinction between plotted groups.
To mitigate this issue, we can use generate_pattern_cycler() to get a cycler of fill patterns that characterize each group.
styles = generate_pattern_cycler()

plt.figure(figsize=(7, 5))
for x in range(1,5):
    plt.bar(x, np.random.randint(2,10), label=f"Bar {x}", **next(styles))
plt.xlabel("Category")
plt.ylabel("Amount")
plt.show()
Example: histogram
styles = generate_pattern_cycler()
plt.figure(figsize=(7, 5))
x = np.random.randn(1000)
plt.hist(x, bins=30, density=True, **next(styles))
plt.xlabel("$x$")
plt.ylabel("$f(x)$")
plt.show()
Example: pie
plt.figure(figsize=(7, 5))
pie = plt.pie(
    [2, 3, 1, 5, 7, 9],
    labels=["two", "three", "one", "five", "seven", "nine"],
)

styles = generate_pattern_cycler()
for part in pie[0]:
    part.set(**next(styles))
Heavily adopted from Olsgaard’s post


