Option Analysis and Prediction using Fast Fourier Transform and Levy Alpha Stable Distributions
This project uses a number of concepts.
-
Black Scholes model.
-
Capital Assets Pricing Model (CAPM).
-
Levy Alpha Stable Distributions.
-
Market Model.
-
Fourier and Inverse Fourier Transformations.
The files of the project are all over the place but each file deals with a certain topic. I have also included a docx file explaining the entire theorem in the data folder.
However the following concept can be critical to understand.
-
Options are regularly proced using the BS model.
-
Volatility in stock markets and securities are regularly functions of normal distributions according to a number of models.
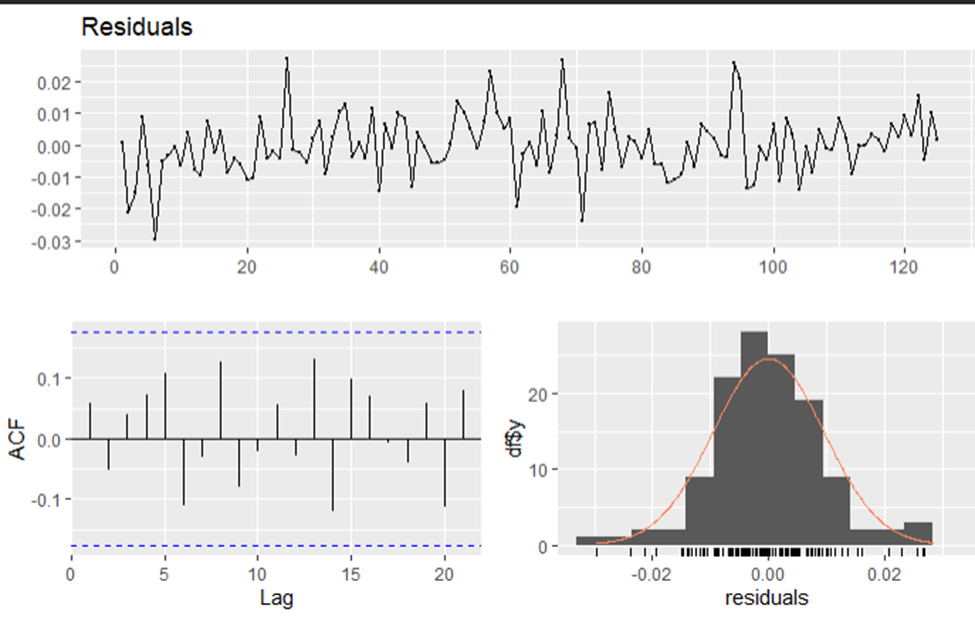 Figure 1.1 CAPM Model
-
Technical analysis incorporates normal distributions. This can also be seen in the thrid graph in the image above. The residuals are trying to get fit under a normal curve.
-
Beta Coefficient explains risk in a regression model of market prices with underlying asset.
-
Beta distributions can take different forms depending on the shape and scale parameters assigned to it. Bet coefficients are not related to beta distributions
-
Prior analysis has shown that in some cases fitting a different distribution similar to the normal explains better the fractals and risk numbers in a market.
-
Levy Distributions are extracts of the stable distributions. According to wikipedia, beta distributions are not “”not analytically expressible, except for some parameter values””. Normal distribution is also a stable distribution with an alpha = 2
-
This being so, – All stable distributions are infinitely divisible. – With the exception of the normal distribution (α = 2), stable distributions are leptokurtotic and heavy-tailed distributions.
-
The characteristic function φ(t) of any probability distribution is just the Fourier transform of its probability density function f(x).
-
The density function (pdf) is therefore the inverse Fourier transform or the fast fourier of the characteristic function.
Although the probability density function for a general stable distribution cannot be written analytically, the general characteristic function can be expressed analytically.
Having understoodm these ten simple facts. You already have a mind map of the whole paper.
Instead of using normal use levy, but since levy does not have pdf, use fast fourier to find it. Fit the residuals of the market using the levy. Find the shape and scale parameters. Also the alpha and beta.
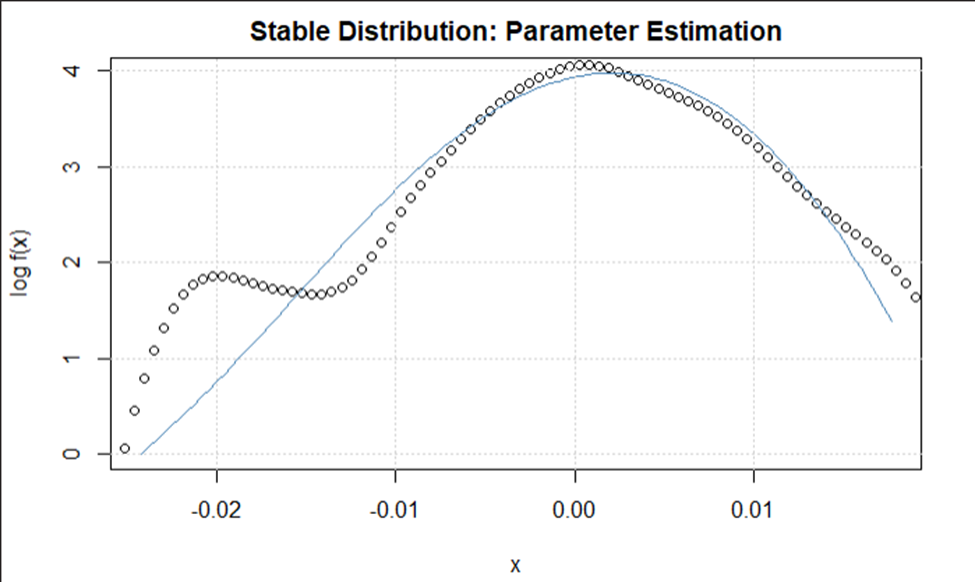 Figure 1.2 Dow Jones Levy Alpha Distribution
The files
- DJIA – Dow Jones
- PF – Pfizer
- fft – Fast Fourier Transform djia.rmd is an R file making analysis on the Down Jones index for stated period. pfe.rmd – analysis on pfizer stock for stated period. fft.py – is the fast fourier transform implemented. levystable.py – is the levy stable distribution inside scipy library. hs.csv is a combined data file having side by side stocks of dow jones and pfizer. pfe.csv has only pfizer historical prices
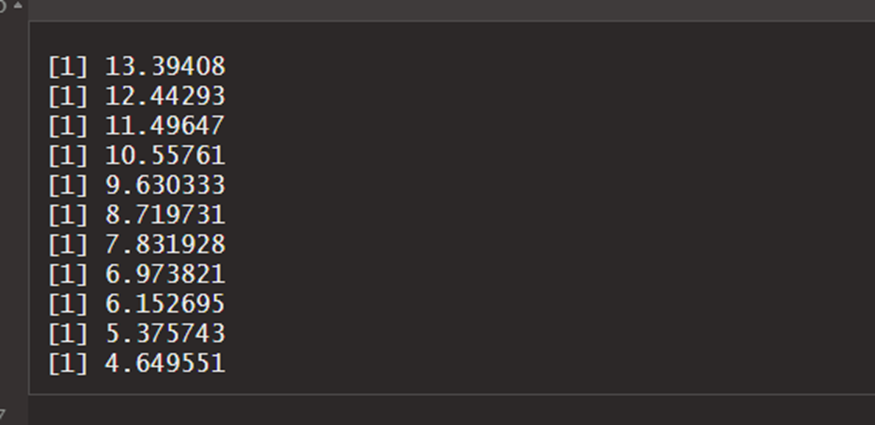 Figure 1.3 Predictions made using regular BS model.
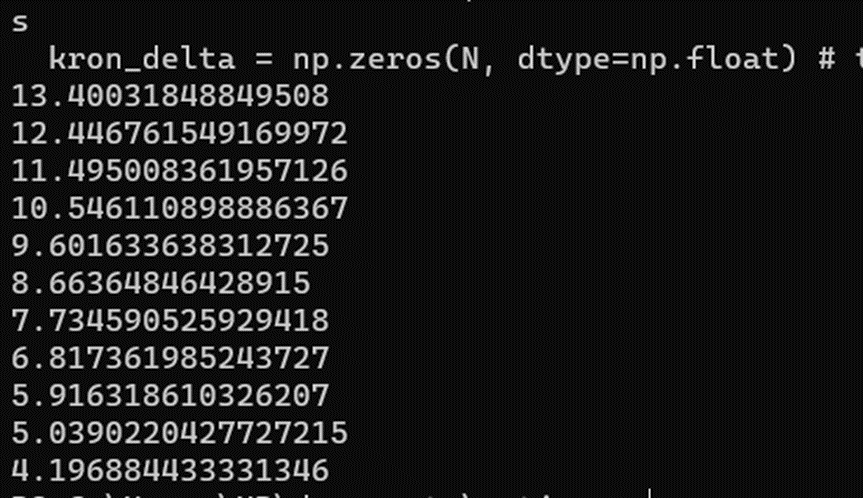 Figure 1.4 Predictions made using levy alpha.