Predicting-Yelp-Review-Quality
Predicting the usefulness of reviews given the review text and metadata surrounding the reviews
Motivation
I have a personal and professional interest in the leisure/tourism industry with a focus on two things:
- The perceived quality and popularity of places and points of interest (POIs).
- Examples: Restaurants, Bars/Nightlife, Breweries, Music Venues, Parks and Outdoor Spaces.
- Very broad focus. Pretty much anything that involves the combination of leisure and being in public.
- Creating a way to connect people to these places/POIs in a way that is more beneficial to both the places/POIs and the people than current common methods.
Yelp and other similar companies like Foursquare, Google Places, TripAdvisor, etc. are the current leaders in this space, though I believe there are substantial untapped opportunities in this space.
Working with and better understanding the data available to these companies will help us to more fully take advantage of these opportunities.
Goal and Central Questions
The goal of this project is to explore a way to increase user retention, satisfaction, and engagement for Yelp and any other company that incorporates reviews within its platform. These improvements will be accomplished by predicting the highest quality reviews via information gained from the review text and data surrounding the reviews.
Central Questions
1. Can the quality of a review be determined by the review text or the data surrounding the review?
2. What types of data are most useful for predicting review quality?
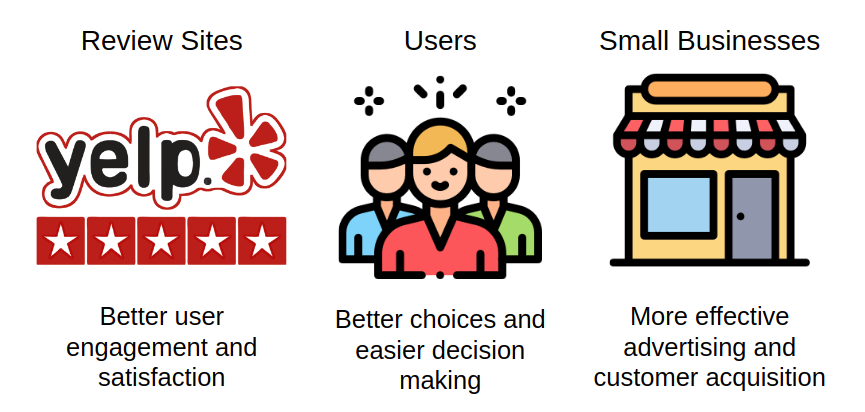
Why Quality Reviews Are Important
The Data
The data for this project comes from the Yelp Open Dataset.
Dataset, Documentation, Yelp Github, Kaggle
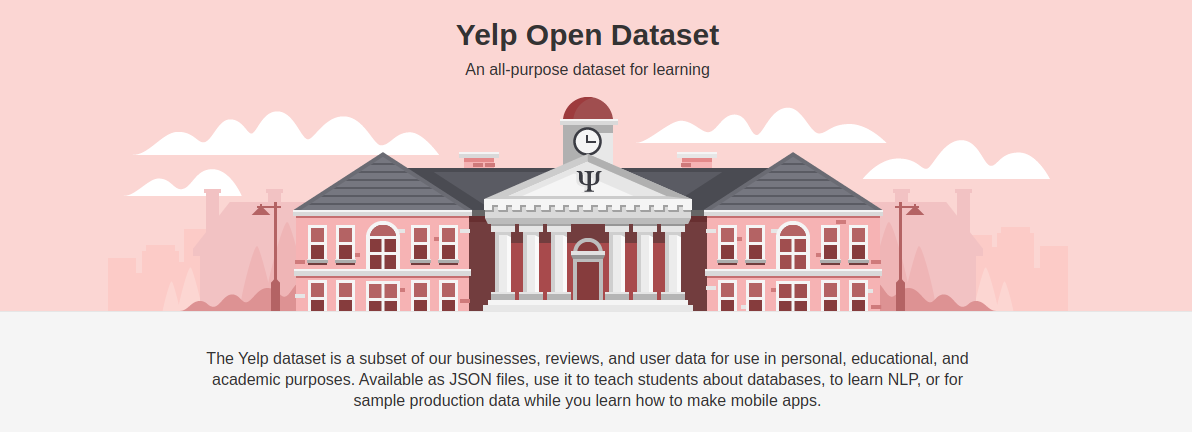
About Yelp
"Yelp connects people with great local businesses. With unmatched local business information, photos and review content, Yelp provides a one-stop local platform for consumers to discover, connect and transact with local businesses of all sizes by making it easy to request a quote, join a waitlist, and make a reservation, appointment or purchase. Yelp was founded in San Francisco in 2004."
Yelp News, Fast Facts and Stats
About the Data
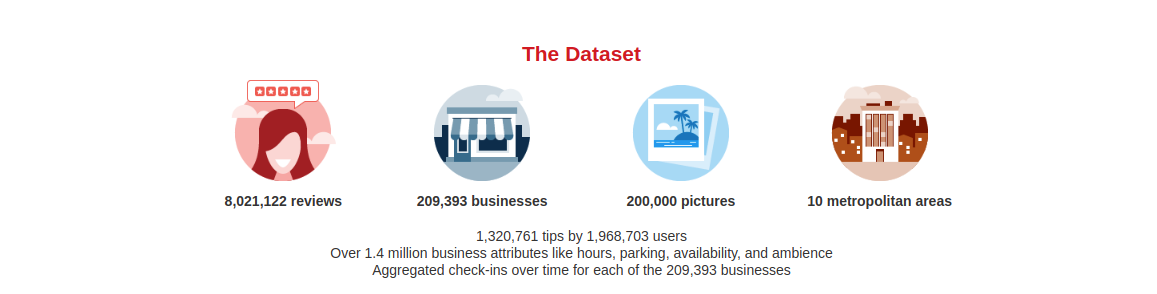
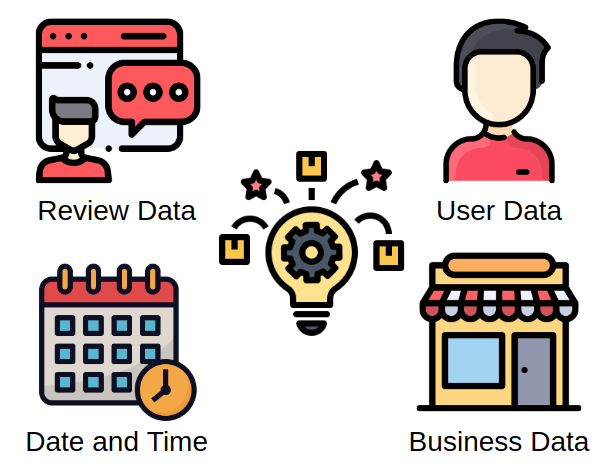
This dataset consists of 5 separate json files totaling ~10GB of data uncompressed. Overall, there is a mix of data-types. The most common ones include long text strings, date-times, booleans, and numerical counts/ratings. There are plenty of nan/null values but this is partially offset by the size of the dataset. The five files consist of:
- Users- ~2 million rows and 22 features
- User metadata, list of friends, and stats about interactions with other users.
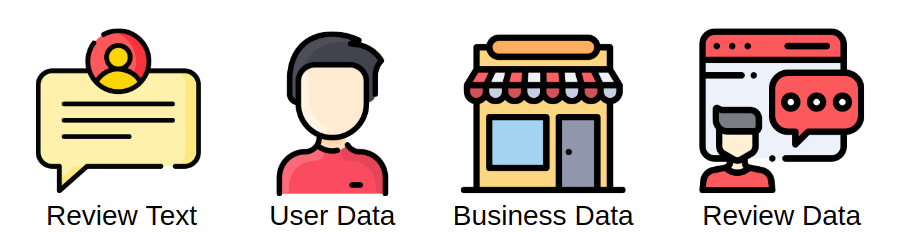
- Reviews- ~8 million reviews with 9 features.
- 8 review metadata features and the review text.
- Check-ins- ~175000 businesses represented. A couple million total date-times.
- Date-times for check-ins for each business.
- Businesses- ~210000 rows with around 30 total features.
- Business name, address, hours, rating, review count, etc.
- Also includes dictionaries of more in-depth attributes like cost, accepts credit cards, good for kids, etc.
- Tips- ~1.3 million rows with 5 features
- Kind of like a really short review without as much useful metadata.
Data Storage
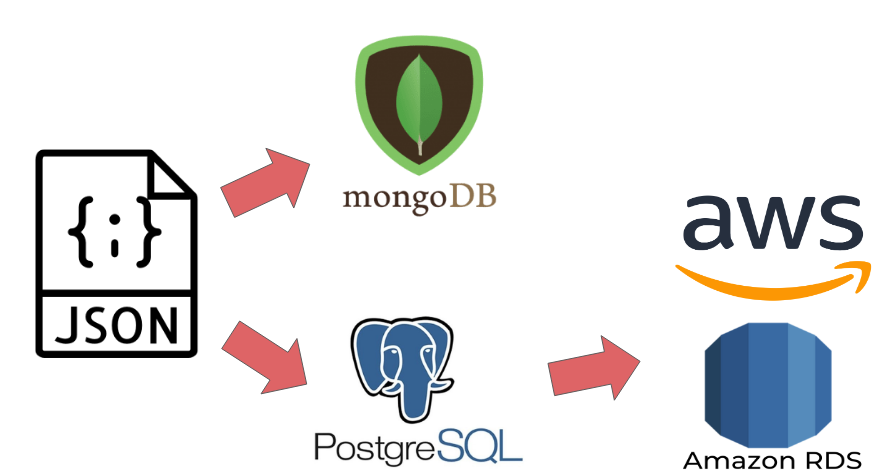
My original data came in 5 json files. The first step was to simplify, combine, and store these files in a way that would be easily searchable for future data analysis, cleaning, and feature engineering.
I worked in MongoDB for a little bit but ended up going the SQL route due to only having a subset of the data. If I was dealing with all of the data like Yelp is, it would be reasonable to make more use of NoSQL databases like MongoDB.
This database will eventually be stored on AWS for easier access when scaling up the prediction process.
Original Working Dataset
Below is a brief look at the original data after I ran it through my data storage process.
| review_id | user_id | business_id | review_stars | review_date | review_text | review_useful | review_funny | review_cool | restaurant_name | restaurant_address | restaurant_city | restaurant_state | restaurant_postal_code | restaurant_latitude | restaurant_longitude | restaurant_overall_stars | restaurant_review_count | restaurant_is_open | restaurant_categories | restaurant_price_range | user_name | user_review_count | user_yelping_since | user_useful | user_funny | user_cool | user_elite | user_friends | user_fans | user_average_stars_given | user_compliment_hot | user_compliment_more | user_compliment_profile | user_compliment_cute | user_compliment_list | user_compliment_note | user_compliment_plain | user_compliment_cool | user_compliment_funny | user_compliment_writer | user_compliment_photos | restaurant_checkins | |
|---|---|---|---|---|---|---|---|---|---|---|---|---|---|---|---|---|---|---|---|---|---|---|---|---|---|---|---|---|---|---|---|---|---|---|---|---|---|---|---|---|---|---|---|
| 0 | 48GS5BhOe5Q0exkwH4qIig | r5IC7MVMH9wL-IQKx2CmXg | uh7DUWtPoZkuEE05fghJ_w | 5 | 2016-06-24 14:52:55 | Living in NYC and having ... | 1 | 0 | 0 | Beauty & Essex | 3708 S Las Vegas Blvd, Le... | Las Vegas | NV | 89109 | 36.1099 | -115.175 | 4 | 1078 | 1 | Lounges, Restaurants, Nig... | 3 | Kelly | 122 | 2009-08-19 15:54:29 | 191 | 79 | 41 | 7Mhup6mfEgNAyHyfSBpQ6w, R... | 5 | 3.81 | 1 | 0 | 0 | 0 | 0 | 0 | 2 | 0 | 0 | 0 | 0 | 2016-05-11 02:52:26, 2016... | |
| 1 | WxqwVmZhq5-kvvRsUun1-w | 8Dvr-U6jCZTVGD52LwC2qA | orS5gYr8phw6YfV-oEPnTw | 4 | 2018-03-22 03:32:12 | Very, very good rice roll... | 3 | 0 | 2 | Pho Xin Chào | 7057 Yonge Street | Markham | ON | L3T 2A6 | 43.7996 | -79.4201 | 4 | 49 | 1 | Desserts, Food, Restauran... | 2 | Amy | 388 | 2015-11-20 04:33:32 | 1149 | 83 | 265 | 2017,2018 | CQ67NJigSe5-uBDX3b_CUw, e... | 41 | 3.78 | 7 | 0 | 0 | 0 | 0 | 9 | 13 | 7 | 7 | 12 | 12 | 2018-03-04 18:29:48, 2018... |
| 2 | 5XwWfBkibiJLn9wBnD2QTQ | 3_a4J7RFtAOSh2maSH1Dlg | ZjKpGYdQCQPxzkYWAsV56w | 5 | 2018-05-18 16:26:27 | The service was quite goo... | 0 | 0 | 0 | Thailicious Authentic Tha... | 19 S Stephanie St, Ste 16... | Henderson | NV | 89012 | 36.0282 | -115.049 | 4.5 | 604 | 1 | Restaurants, Thai, Vegeta... | 2 | Marsha | 8 | 2016-02-29 03:03:48 | 0 | 0 | 0 | 8CQRuR-tjDy6uuGU8R7zeg, W... | 0 | 3.88 | 0 | 0 | 0 | 0 | 0 | 0 | 0 | 0 | 0 | 0 | 0 | 2017-09-07 19:49:06, 2017... | |
| 3 | B7a8BnvPzCy90yblleT1kQ | 45kX9LyeR_Z4jRcxDAh0cA | ZjKpGYdQCQPxzkYWAsV56w | 5 | 2018-05-05 00:26:20 | The servers were super sw... | 0 | 0 | 0 | Thailicious Authentic Tha... | 19 S Stephanie St, Ste 16... | Henderson | NV | 89012 | 36.0282 | -115.049 | 4.5 | 604 | 1 | Restaurants, Thai, Vegeta... | 2 | Lesly | 4 | 2015-11-15 03:55:35 | 0 | 0 | 0 | yDA1FKynHAncG5CiSc8_Zg, x... | 0 | 3 | 0 | 0 | 0 | 0 | 0 | 0 | 0 | 0 | 0 | 0 | 0 | 2017-09-07 19:49:06, 2017... | |
| 4 | y0OM430M5gfDJna7I_L5kw | FS6dSo0sGtzeeO9XAoGE4Q | uh7DUWtPoZkuEE05fghJ_w | 4 | 2017-08-07 01:11:41 | Came here with a group of... | 0 | 0 | 0 | Beauty & Essex | 3708 S Las Vegas Blvd, Le... | Las Vegas | NV | 89109 | 36.1099 | -115.175 | 4 | 1078 | 1 | Lounges, Restaurants, Nig... | 3 | Kristi | 224 | 2009-08-31 03:23:42 | 227 | 59 | 90 | 2013,2014,2015,2016,2017 | a4CC6waxI5Qd-QWUnMUOHA, o... | 7 | 3.95 | 2 | 2 | 2 | 0 | 0 | 3 | 4 | 4 | 4 | 5 | 0 | 2016-05-11 02:52:26, 2016... |
EDA
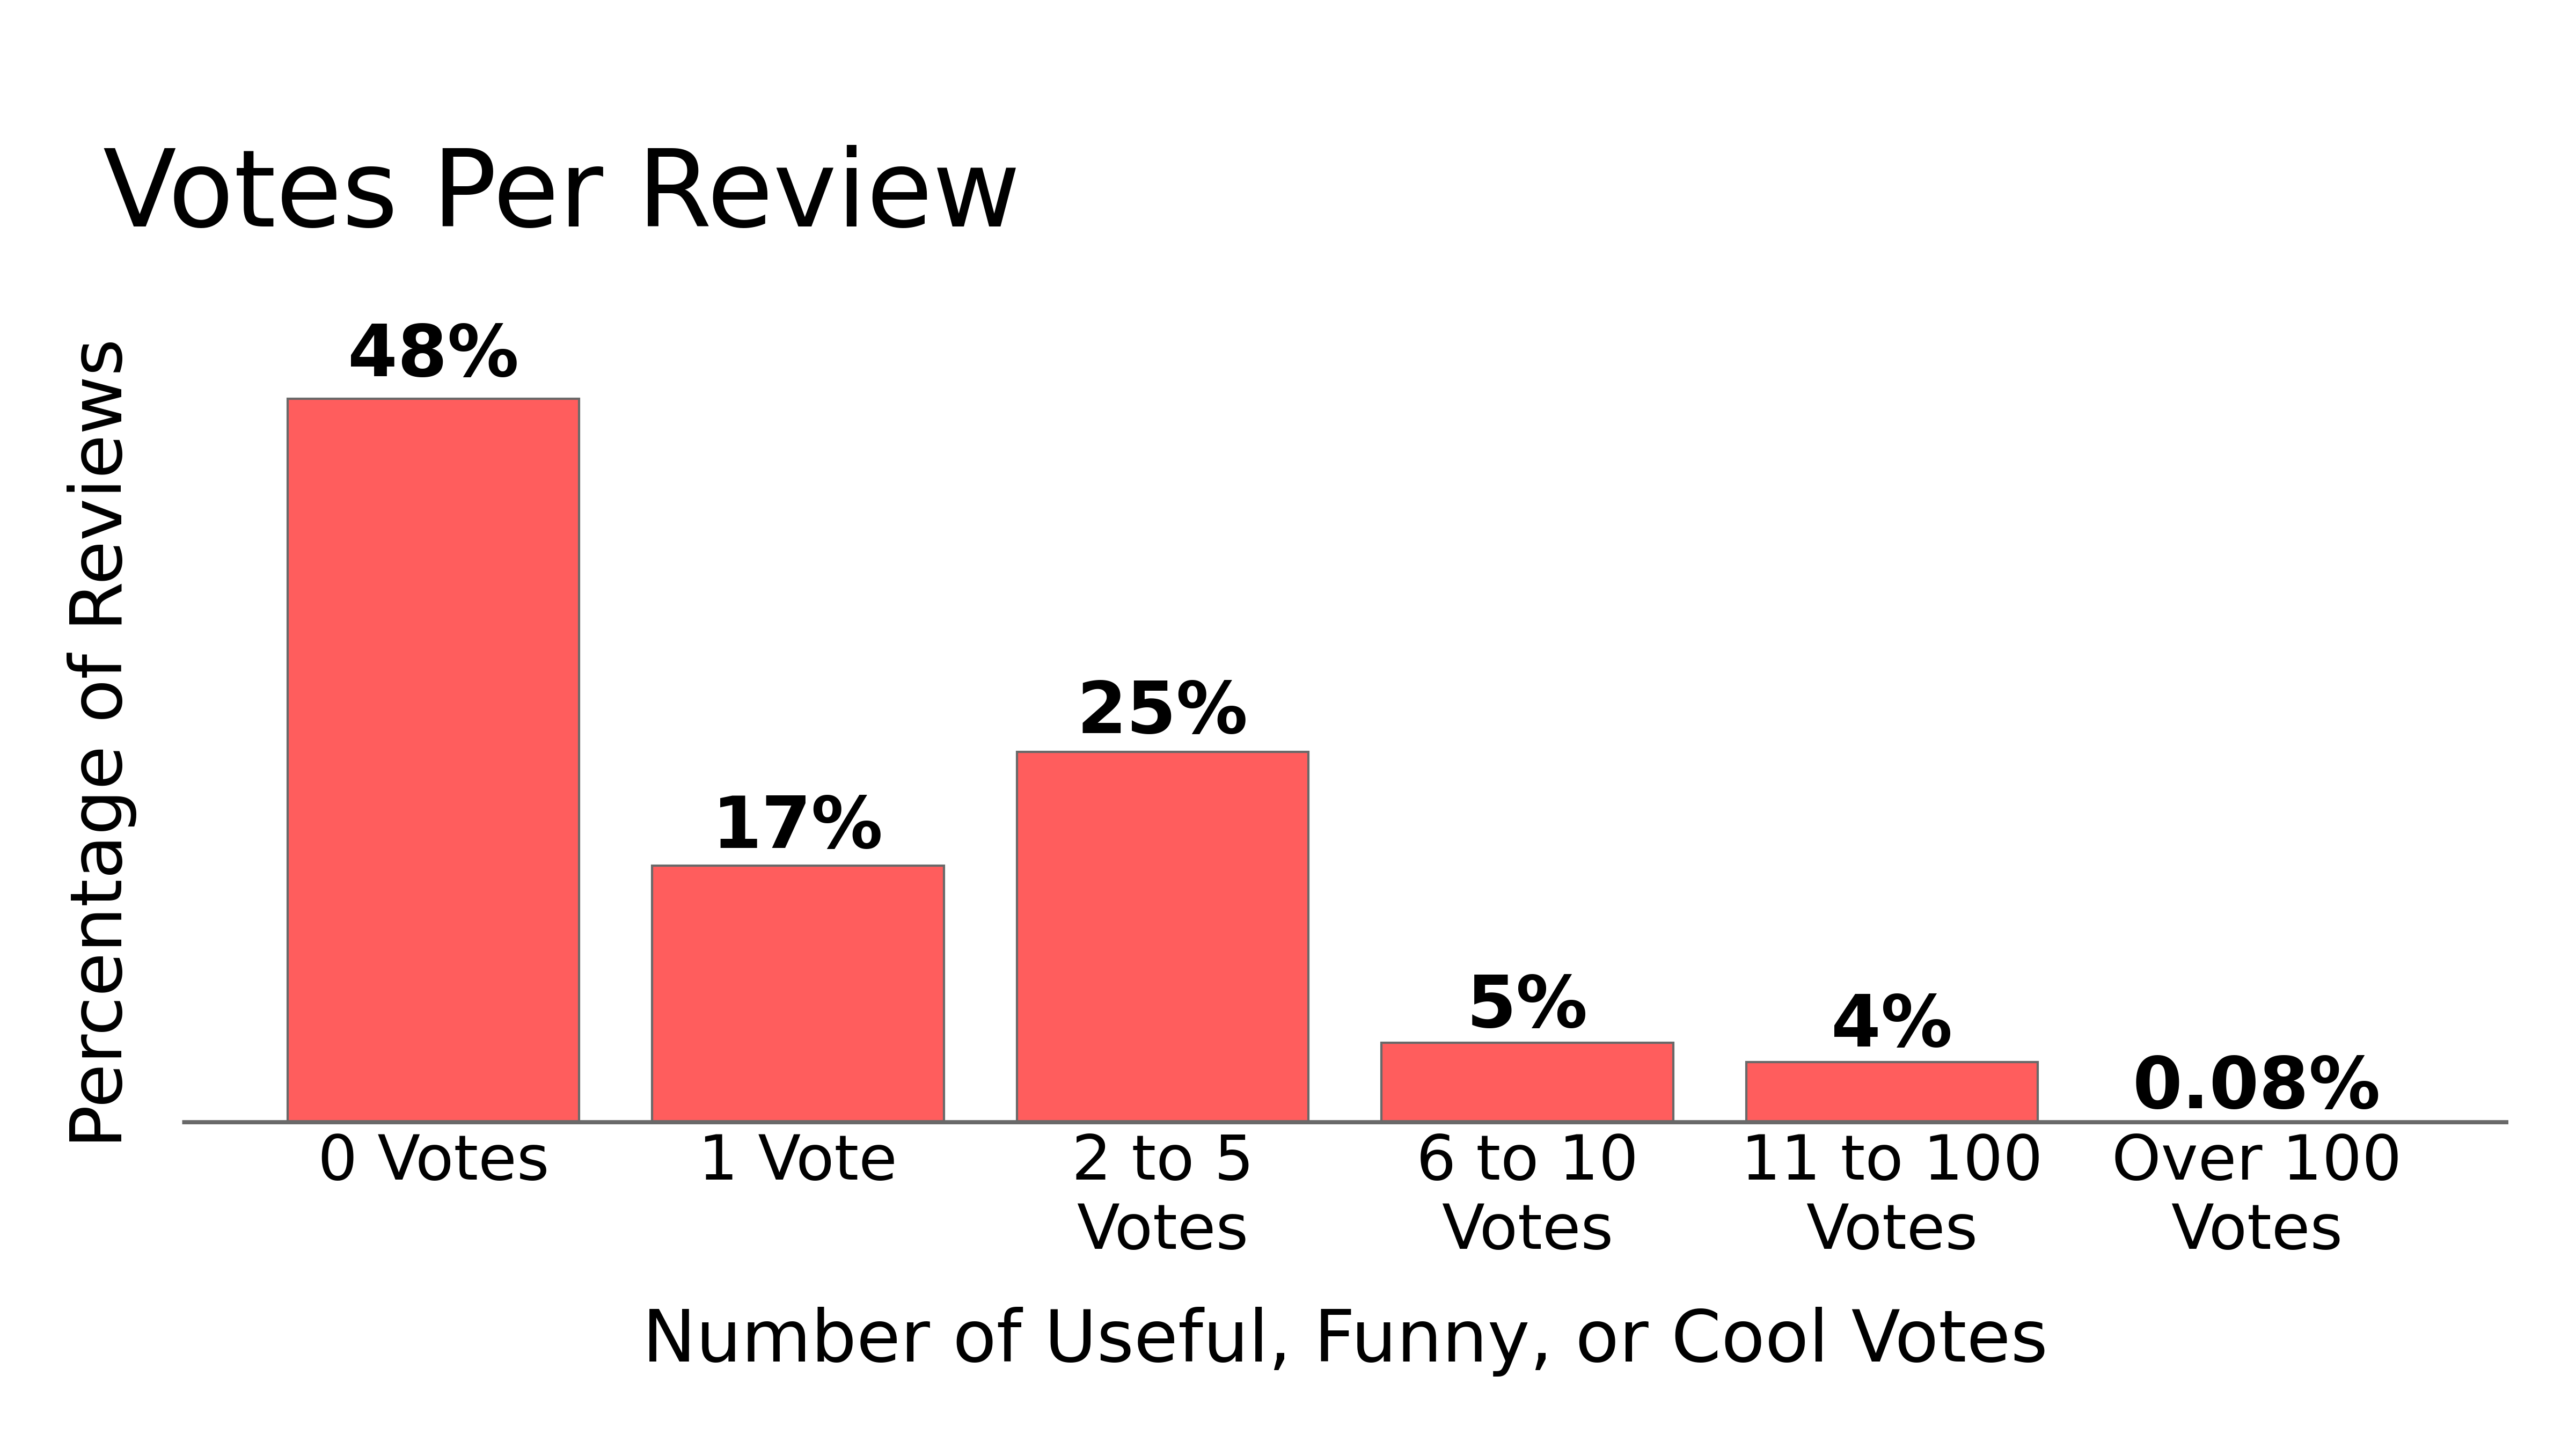
In order to determine the quality of a review I took the sum of the useful, funny, and cool votes that the review has received.
Looking at the distribution of votes per review you can see that about half of all reviews receive no votes at all.
Another sizable portion of reviews receive between 1 and 5 votes.
Very few reviews make it over 10 votes.
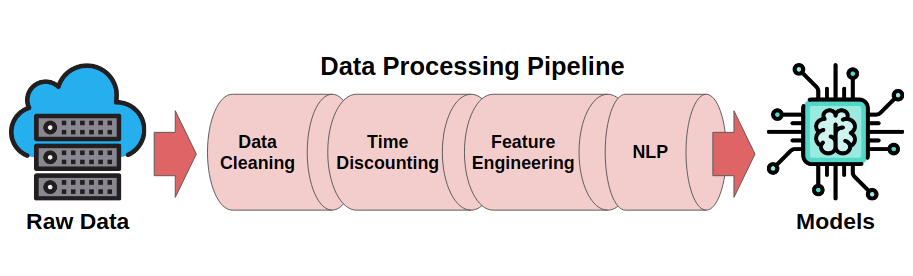
Data Pipeline
The original working data was not going to be very usable for analysis and machine learning model training so I created a pipeline that would clean and organize the data as well as add features that could be informative.
Data Cleaning
The main data cleaning steps included:
- Dropping Nan/Null Values
- The dataset had plenty of data and a relatively low amount of Nan/Null values so any records with Nan/Nulls were dropped.
- Removing Duplicate Records
- Deleting Unnecessary Features
- Overall the data had over 100 features and a lot of them were not useful for answering the central questions.
- Converting Data-types
- This mostly consisted of converting text strings to datetime stamps.
- Organizing Features
- Features were grouped by source type and sorted to make them easier to wok with during eda and feature engineering.
Time Discounting
When trying to use the data to answer the questions I wanted to answer, the passage of time creates an issue that must be addressed.
A lot of the datapoints are counts that were saved at the time the dataset was made public in 2020.
These datapoints increase over time so if we want to use them to predict a review at the time it was created, these datapoints need to be adjusted to represent what they would have been at the time of the review.
There are two major places where time discounting came into importance:
- Target Creation - More recent reviews have less time to accumulate votes. This needs to be adjusted for otherwise older reviews will always seem more useful.
- Feature Engineering - Utilize actual or estimated counts at the time of the review instead of at the time the dataset was released.
Target Creation
The first goal is to predict the quality of a review but what exactly should we be trying to predict?
Options:
- Whether a review is quality or not. (Binary Classification)
- The level of review quality. Zero, Low, Medium, High (Multi-Class Classification)
- A numerical value of quality. (Regression)
- A ranking of the review quality among other reviews. (Ordinal Regression, Classification)
All of these targets have positives and negatives. The focus here is on option 1 since it is the easiest to understand and avoids some of the time discounting pitfalls.
Metadata Feature Engineering
To try and make it easier to determine if a review is quality, I created new features about the data based off of the interactions between current data features as well as changes in time.
For example, knowing the star rating of a review might be useful but it is probably more useful to know how much more or less that star rating is than the average rating.
Features added include:
- Sums
- User Up-votes
- User Compliments
- Counts
- User Friends Count
- User Elite Award Count
- Business Check-in Count
- Time Based
- User Years Since Last Elite Award
- User Days Active at Review Time
- Composites
- Review Stars vs. User Average
- Review Stars vs. Business Average
NLP Feature Engineering
The most important part of determining the quality of a review is understanding the actual text of the review. To do this I created new data features using Natural Language Processing.
NLP features added include:
- Basic Text Features
- Review Length, Word Count, etc.
- Readability
- Flesch–Kincaid Grade Level
- Parts of Speech
- Noun, Verb, Adjective, etc.
- Syntactic Dependency Relations
- Sentence Structure
- Named Entities
- Person, Place, Event, etc.
- ML Model Predictions
- SVM and Naive Bayes using TF-IDF
Data Modeling
Model Setup
Multiple models were tested and the hyperparameters were tuned using cross validation. For now a random forest is the best performing model.
Model Choice: Random Forest Classifier
Why?
- Easy to setup and work with.
- Good results
- Provided quick feedback on whether the questions were worth pursuing or not.
Binary Classification
Two Options:
- The review in question IS a quality review. Coded as 1.
- The review in question IS NOT a quality review. Coded as 0.
Class Balance
- The classes are very close to equal.
- 48% of reviews are quality.
- 52% of reviews are not quality.
Model Performance Metrics and Decision Threshold
Now - Accuracy
- Most common and well understood metric. Best for an initial proof of concept.
- If the model is not accurate enough then the second central question about feature importances is not worthwhile.
- Default 0.5 threshold. Again to get a feel for if the central question is reasonable.
Later - Precision and Accuracy
- Typically only a couple reviews are shown to a user.
- If a review that is not quality ends up being predicted as quality (a false positive) and then is surfaced out of hundreds of possible reviews. That is a pretty big failure.
- As the total number of reviews to choose from grows, the more costly a false positive becomes and the less costly a false negative becomes.
- In general the threshold will need to raised to help lower false positives.
- Specifically the threshold should be a function of the number of reviews to be surfaced and the total number of reviews to choose from.
- The quality of a review is not necessarily relative.
- The standard for choosing a review is relative.
Model Results
Central Question 1:
Can the quality of a review be determined by data surrounding the review?
After running the random forest I got a prediction accuracy of 73%. This is an improvement over predicting the majority class which is 52% accurate as well as random chance which is 50%.

Feature Importance
Central Question 2:
What types of data are most useful for predicting review quality?
The typical way to answer this sort of question with a random forest is using feature importance. This graph shows the data that was most important for making predictions. Unsurprisingly, the text of the review and the data about the user creating the review are the most useful.
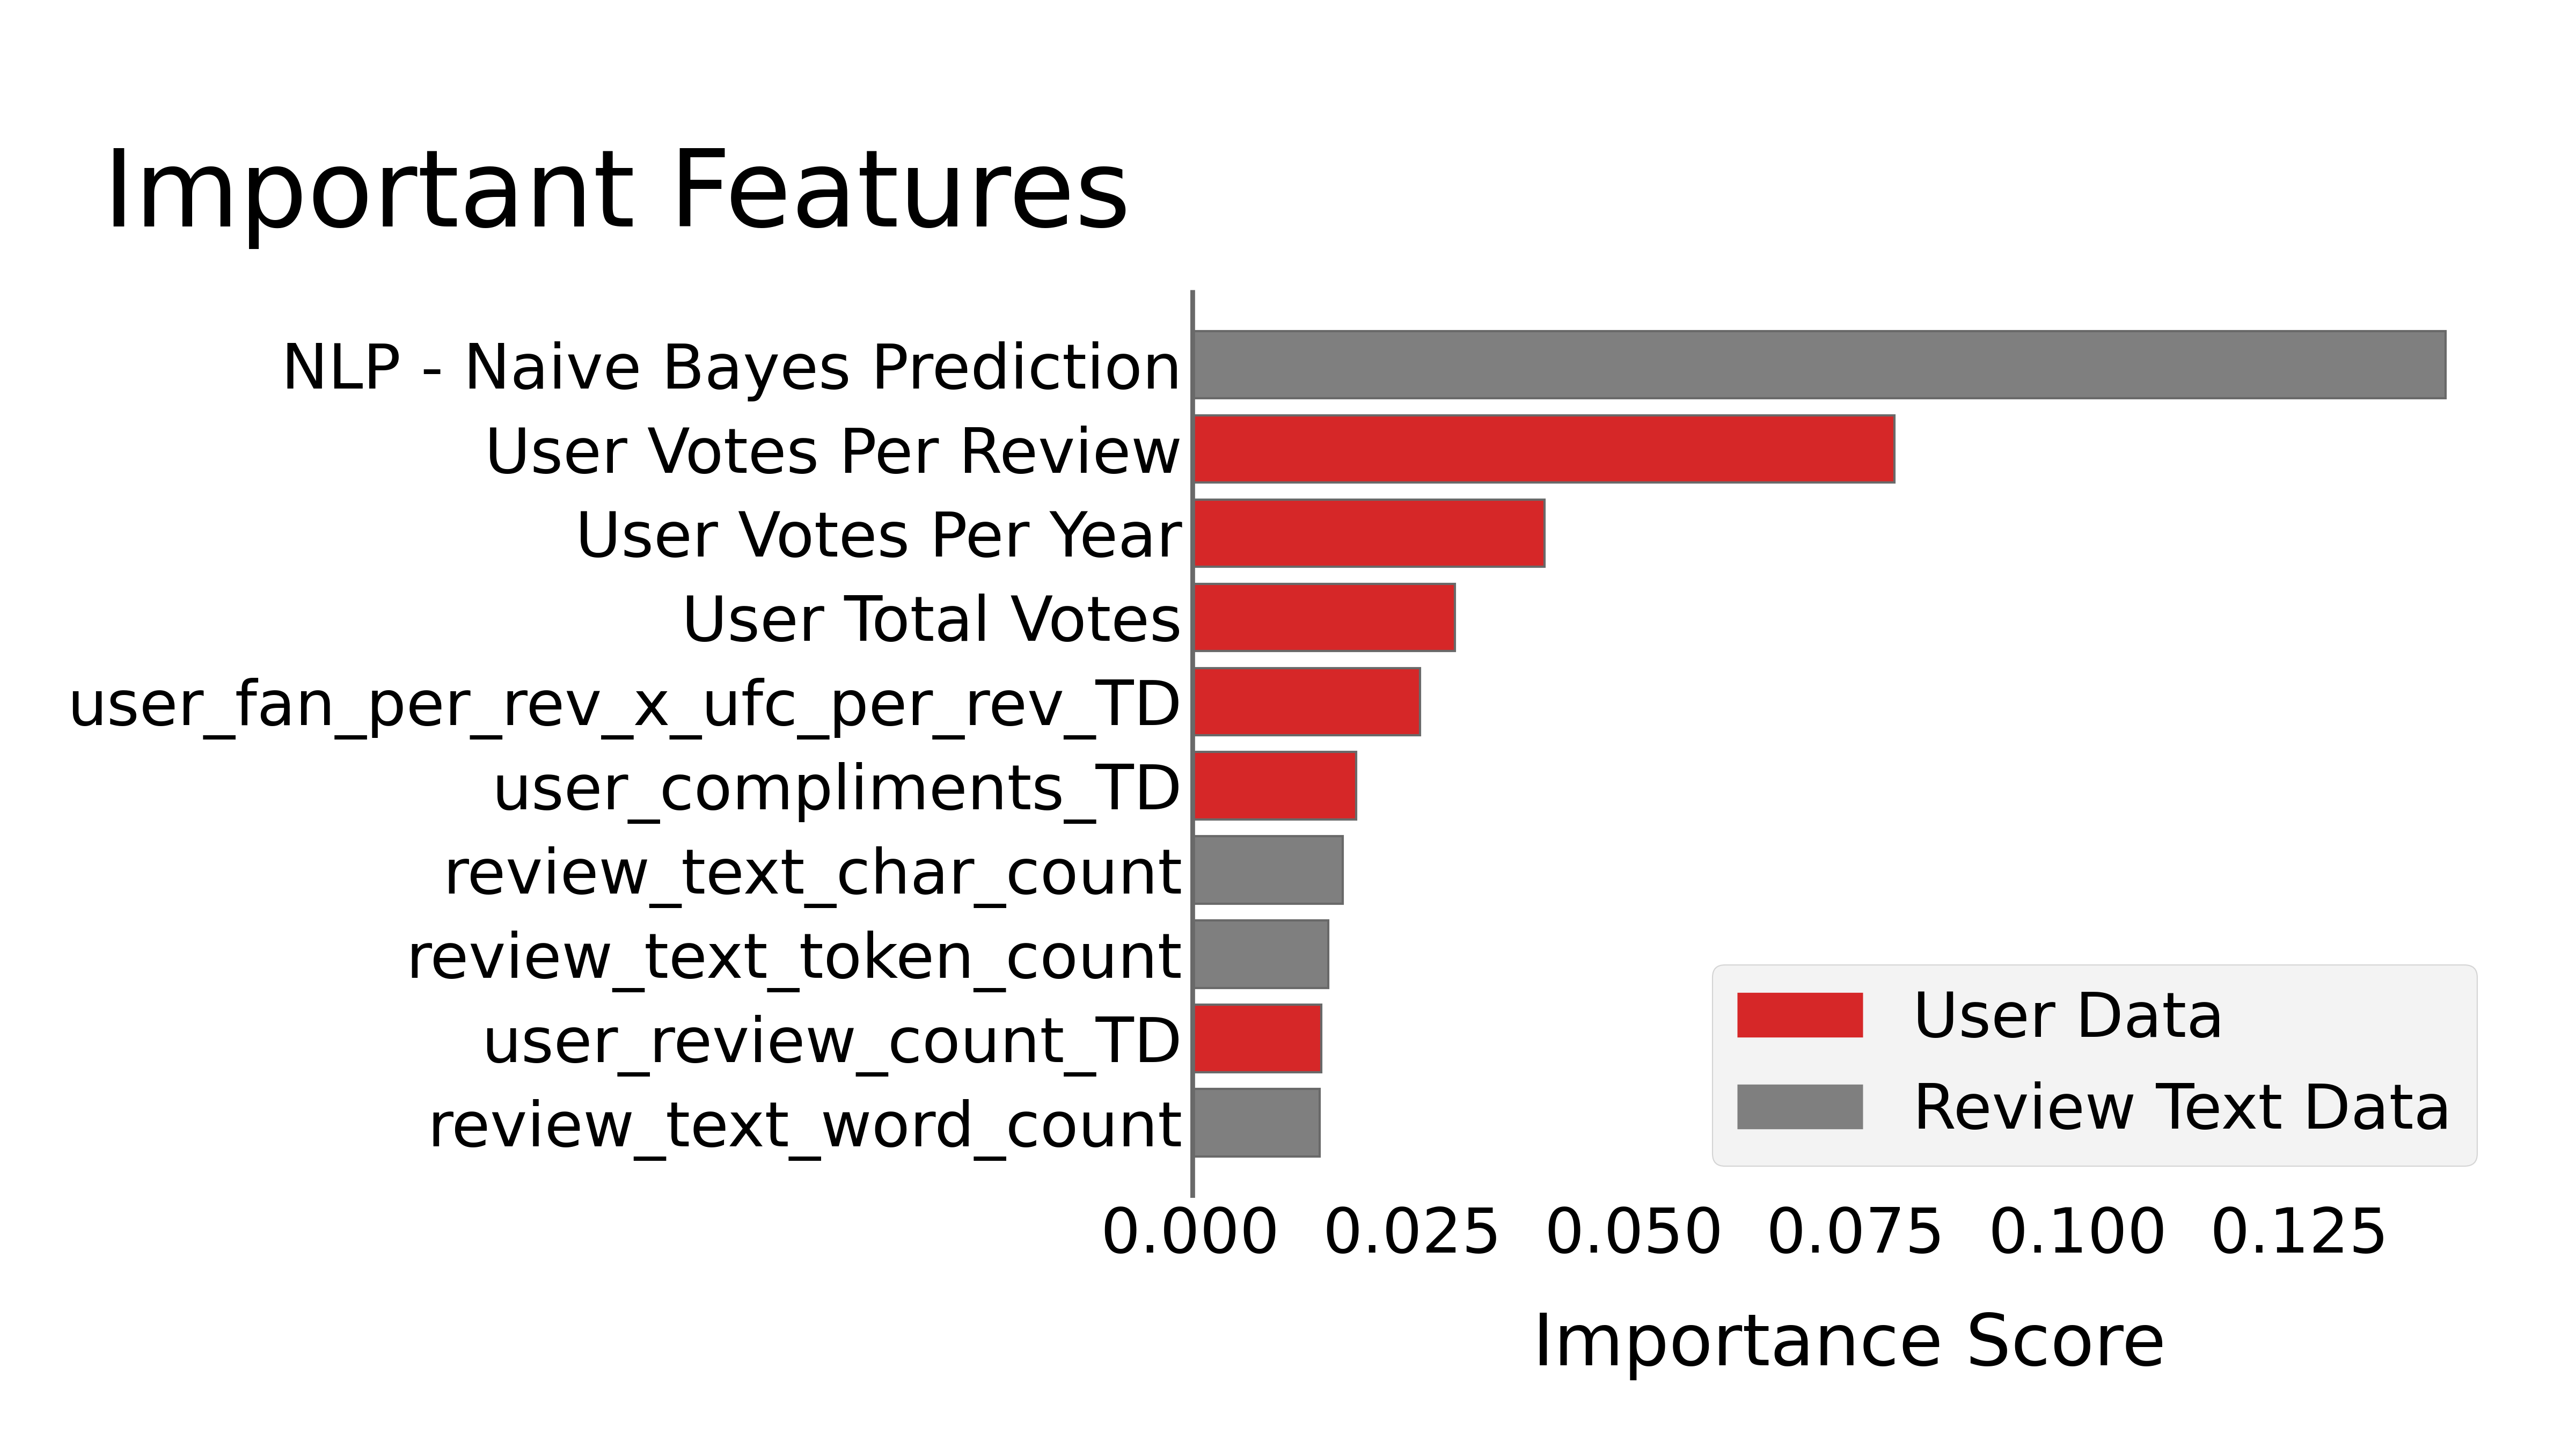
This graph shows the data that was most important for making predictions. Unsurprisingly, the text of the review and the data about the user creating the review are the most useful.
Conclusions
1. The quality of reviews can be determined with an accuracy better than chance.
2. Data about the review text and the user creating the review are the most important to consider when predicting the quality of a review.
Knowing that the quality of reviews can be predicted, as well as which pieces of data are the most important for these predictions is a stepping stone for helping Yelp and similar companies to better surface reviews that improve user retention, engagement and satisfaction. I was only able to scratch the surface of learning about the review text using NLP. Diving deeper in this area is my next goal. Combining NLP with big data tools like AWS and Spark will allow me to improve my understanding of the reviews and improve my model’s predictions in the future.
Next Steps
Improve the ability to predict review quality by:
- Diving deeper into the review text using more NLP tools.
- Improve time discounting adjustments.
- Scaling up the capacity for data analysis by utilizing AWS and Apache Spark.
- Testing new machine learning models including XG Boost and Neural Networks.
- Creating custom cost functions that better represent the overall goal.
GitHub
https://github.com/jeffjohannsen/Predicting-Yelp-Review-Quality


