Timeseries clustering
Timeseries clustering is an unsupervised learning task aimed to partition unlabeled timeseries objects into homogenous groups/clusters. Timeseries in the same cluster are more similar to each other than timeseries in other clusters
This algorithm is able to:
- Identify joint dynamics across the sequences
- Eliminate lags (time-shifts) across sequences (usually called lag-invariance)
- Generate features which are interpretable.
In general, timeseries clustering algorithms are of two types:
- Feature based - transform raw data using feature extraction, run clustering on top of generated features
- Raw-data based - directly applied over timeseries vectors without any space-transformations
Variational Recurrent Auto-encoders (VRAE)
VRAE is a feature-based timeseries clustering algorithm, since raw-data based approach suffers from curse of dimensionality and is sensitive to noisy input data. The middle bottleneck layer will serve as the feature representation for the entire input timeseries.
Architecture
The network
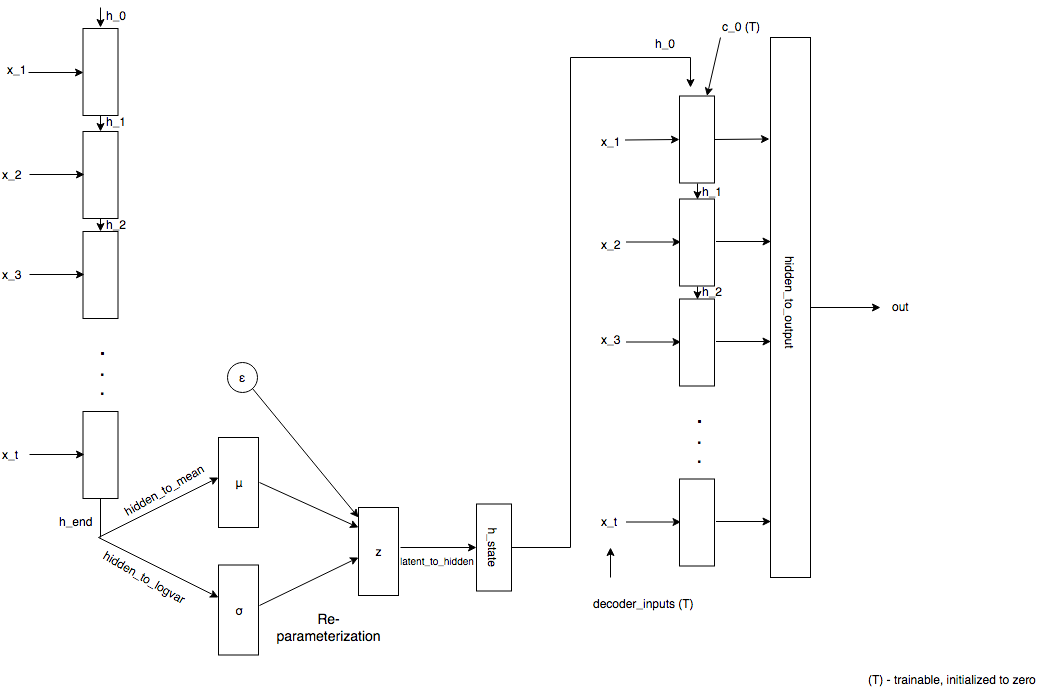
From here on, RNN refers to Recurrent Neural Network architecture, either LSTM/GRU block. Our model comprises mainly of four blocks
- The encoder: A sequence of input vectors is fed to the RNN, last hidden layer
h_end, is plucked from the RNN and is passed to the next layer - The encoder-to-latent layer:
h_endis mapped to the mean and standard deviation by using a linear layer - Given mean and std. deviation, reparameterization is performed during training. This essentially means sampling latent vector from a distribution defined by its mean and std. deviation
- The latent-to-decoder layer: Latent vector sampled is passed through a linear layer to obtain initial states for the decoder RNN.
- The decoder: Given the initial states of the decoder, decoder inputs are initialized to zero and are updated using backpropagation. Outputs of the decoder and passed on to the output layer
- The output layer: This linear layer maps the output of decoder RNN to sequence length to obtain
x_decoded
Loss function
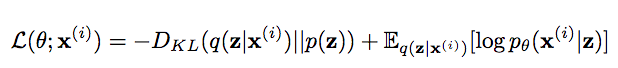
The network is jointly trained on 2 loss functions:
- KL-divergence between the distribution learned in latent space with the normal distribution.
- An auto-encoder learns the identity function, so the sequence of input and output vectors must be similar. In our case, MSE loss is calculated between
x_decodedandxforming the reconstruction error. It signifies the extent to which input is reconstructed. Another option :SmoothL1Loss
Optimizer
Given the gradients and the weights, Adam is used to update the weights. Option provided to use Stochastic Gradient Descent(SGD) for optimization.
Why recurrent neural network in an auto-encoder?
- The length of timeseries may vary from sample to sample. Conventional techniques only work on inputs of fixed size.
- The patterns in timeseries can have arbitrary time span and be non stationary. The recurrent neural network can learn patterns in arbitrary time scale (lag invariance)
- The weight/linear layer in vanilla auto-encoders might grow large in size as the length of time series increases, eventually slowing down the learning process.
Exploratory data analysis is performed on the latent vectors in order to visualize the clusters formed. Since the dimension of z can be more than 2, it has to be converted to a lower dimension to be visualized. PCA and t-SNE are performed to visualize the clusters.
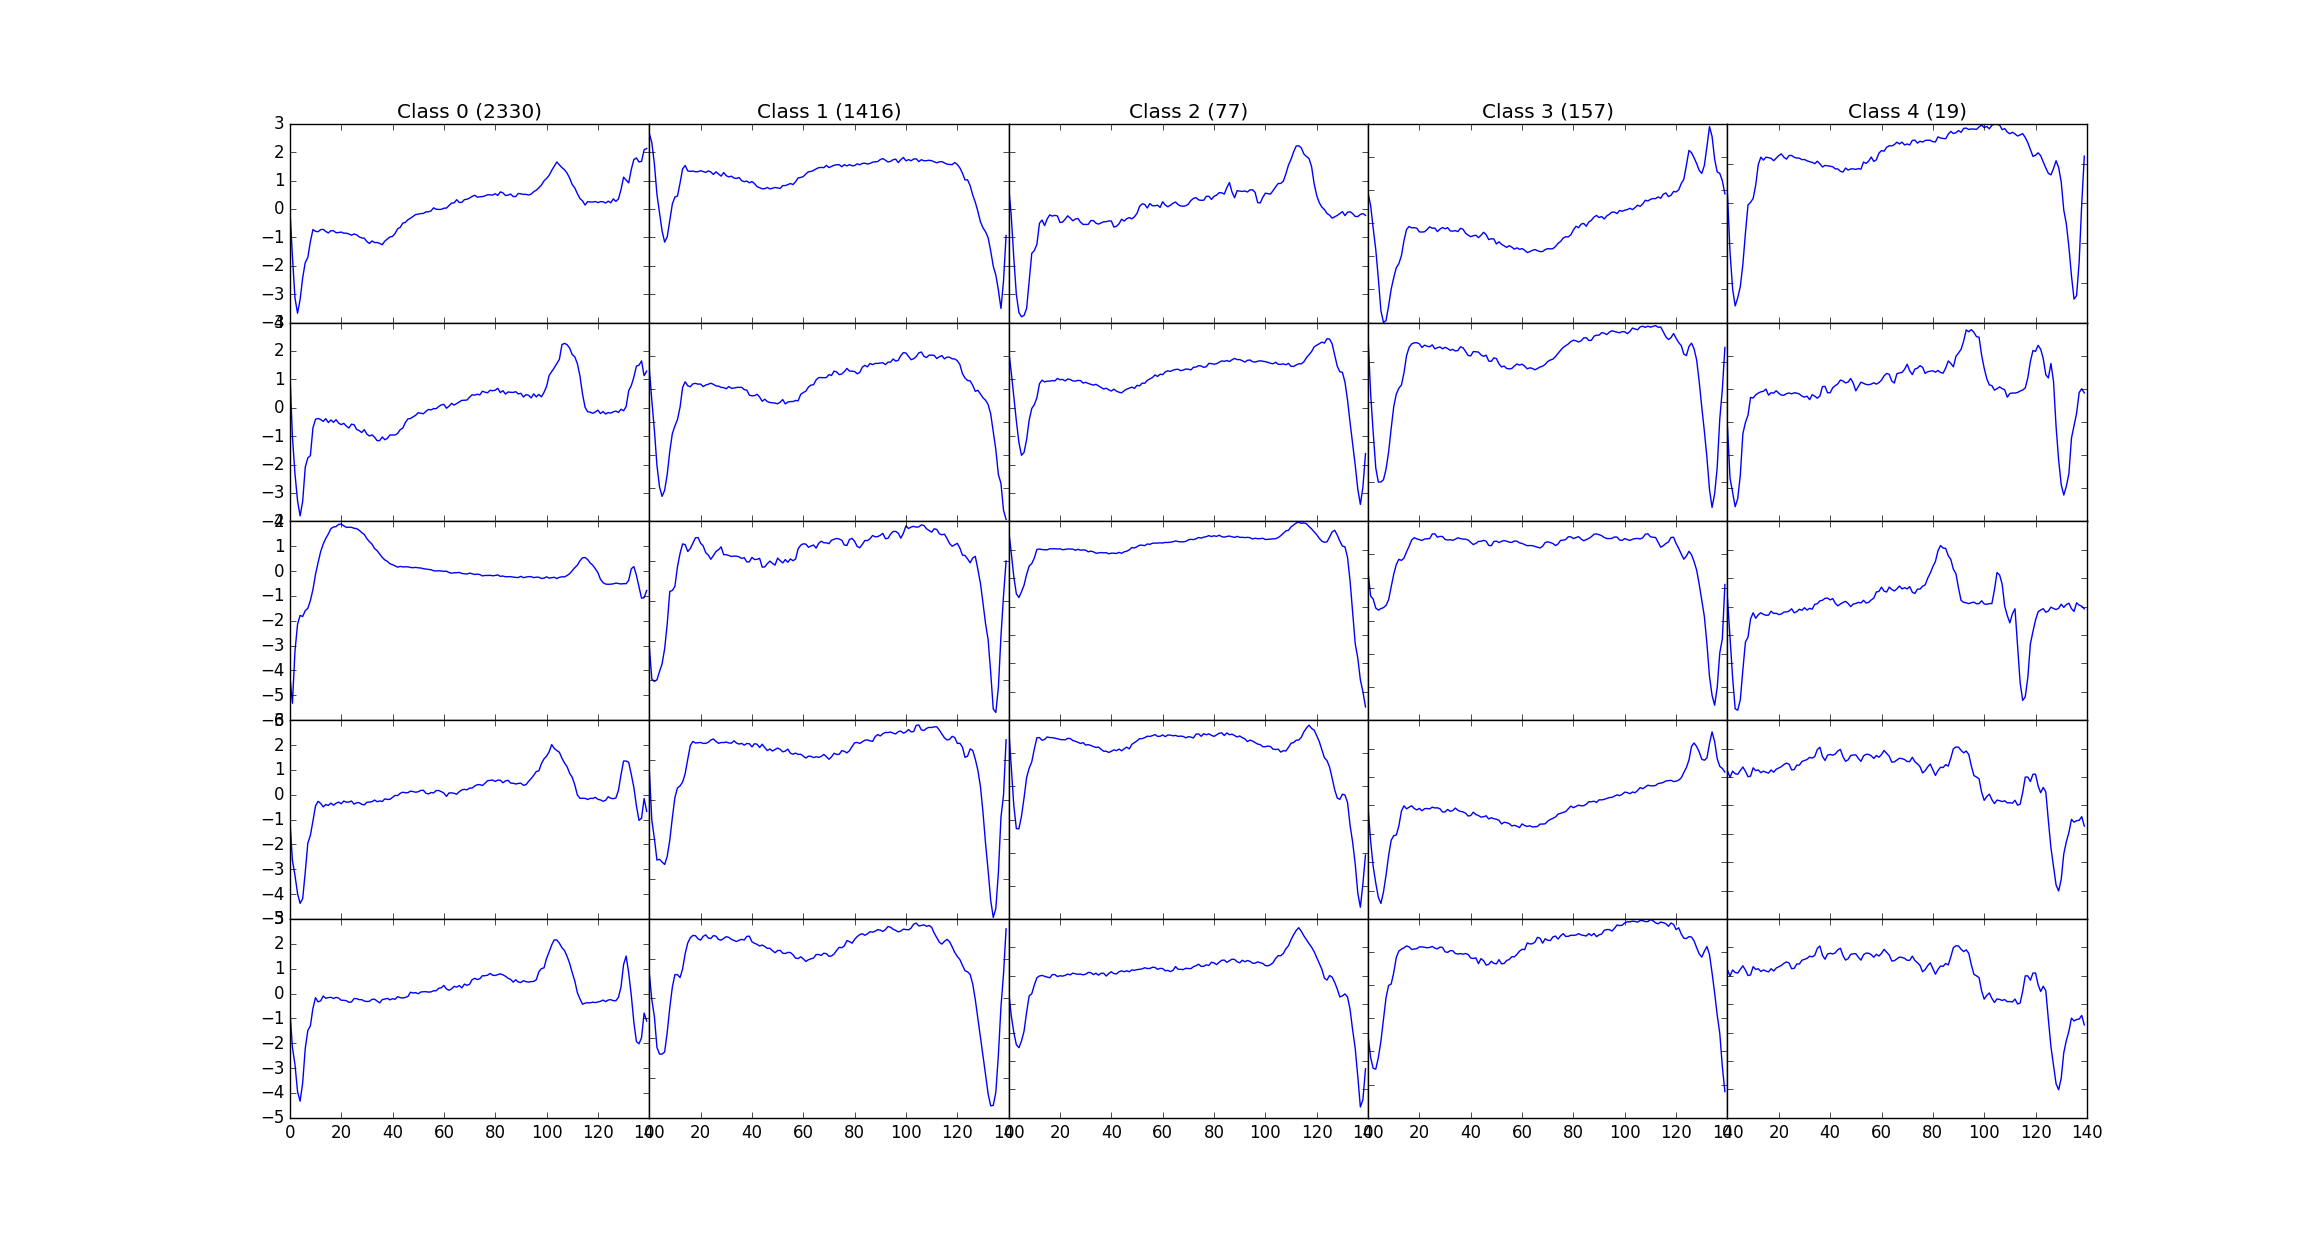
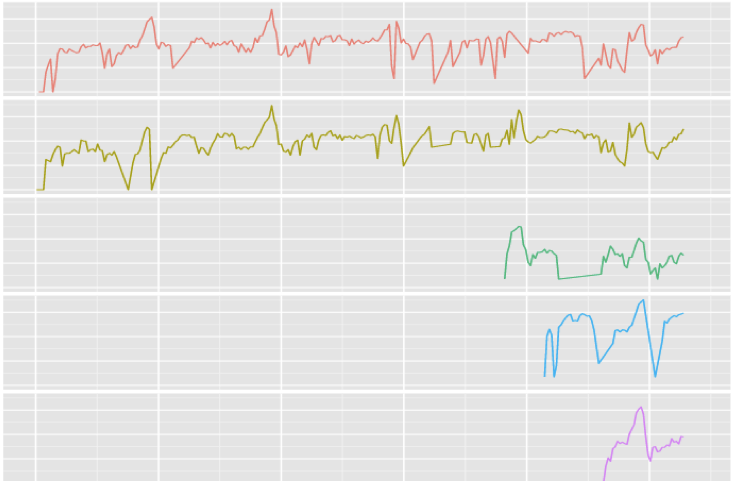
Example - ECG data
The above network is trained on a dataset of 8500 ECG's and tested on 950 ECG's Named ECG5000 on the UCR archive, this dataset has 5 classes, and the labels are used to generate different colors on PCA, tSNE chart.
Here's a snapshot of the data:
Results
When the VRAE model is run on this set of hyperparameters, we get the plots for both PCA and tSNE. PCA and t-SNE are performed in order to convert to a lower dimension and to visualize the clusters. This figure shows that latent space exhibits structure. The pink and green labels obviously cluster in different parts of the space.
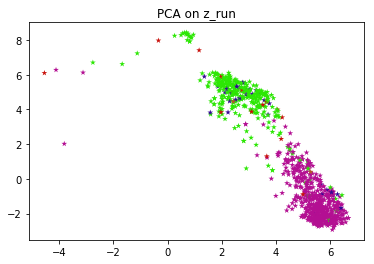
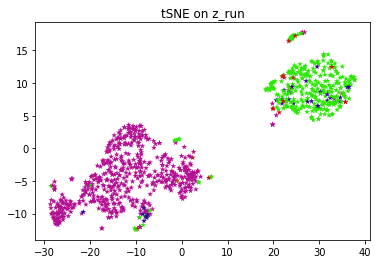
FYI, the entire algorithm is an unsupervised one. Labels are just used to color and visually test the results. If you don't have labels for your application, you can run k-means on top of latent vectors to get labels and use those labels to color individual data points.
Application Areas
- Anomaly detection
- Data reduction
- Determining products with similar selling patterns
- Product cannibalization
- New product introduction
- Low selling items
- Items that are introduced and phased out quite frequently (can't estimate seasonality, data < 1yr)
Solution: Forecast items in groups (borrowed from here)
- Even though each item has a short/sparse life cycle, clustered group has enough data
- Modeling the group as a whole, is more robust to outliers and missing data.
Conclusion
We present variational recurrent auto-encoder that learns the structure in the timeseries. Training is unsupervised. When we color the latent vectors with the actual labels, we show that the structure makes sense.
Requirements
Repo works with:
- python==3.5
- torch==1.0.0
- numpy==1.15.4
- plotly==3.4.2
- scikit-learn==0.20.1
- matplotlib==3.0.2
- scipy==1.1.0


