pygantt
A convenient but aesthetic way of creating a GANTT chart thanks to Plotly library (especially for everyone who doesn't want to do one).
But what is a GANNT ? https://en.wikipedia.org/wiki/Gantt_chart And what Plotly currently offer : https://plotly.com/python/gantt/
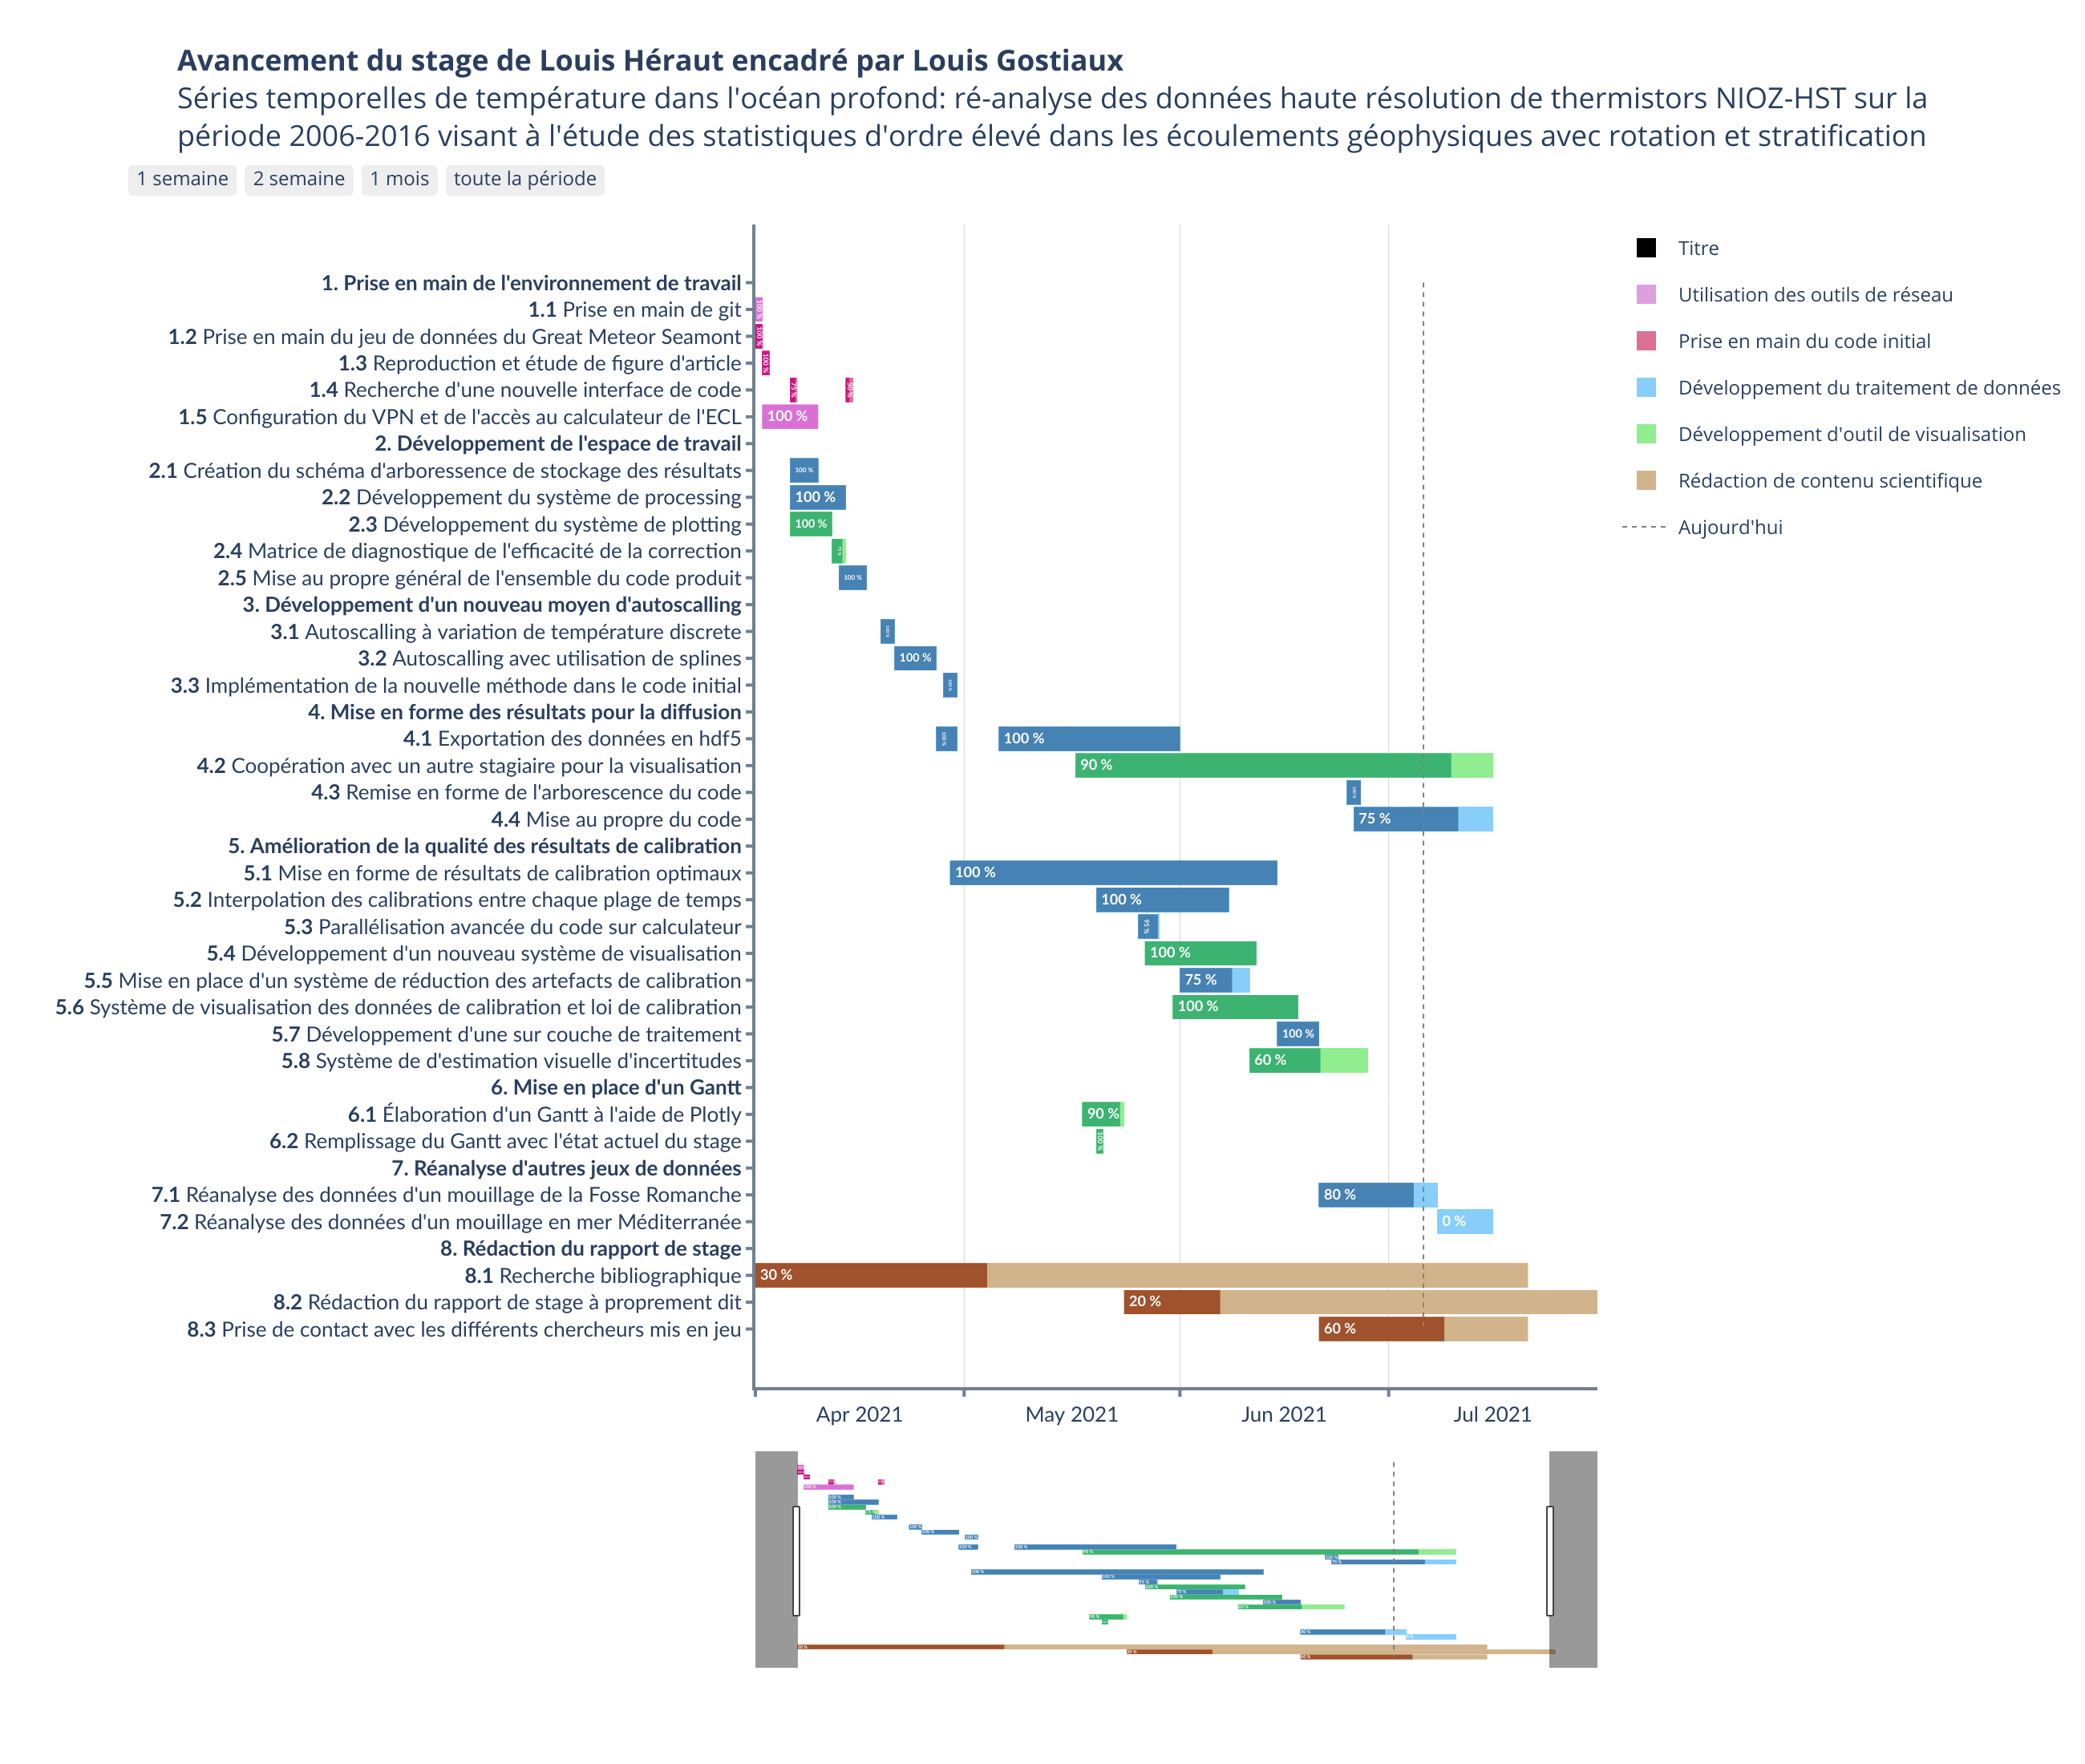
To start a new Gantt use the pygantt.py file. Otherwise an example python file is present to generate the example html output. Here is a general preview of the example_pygantt.html file :
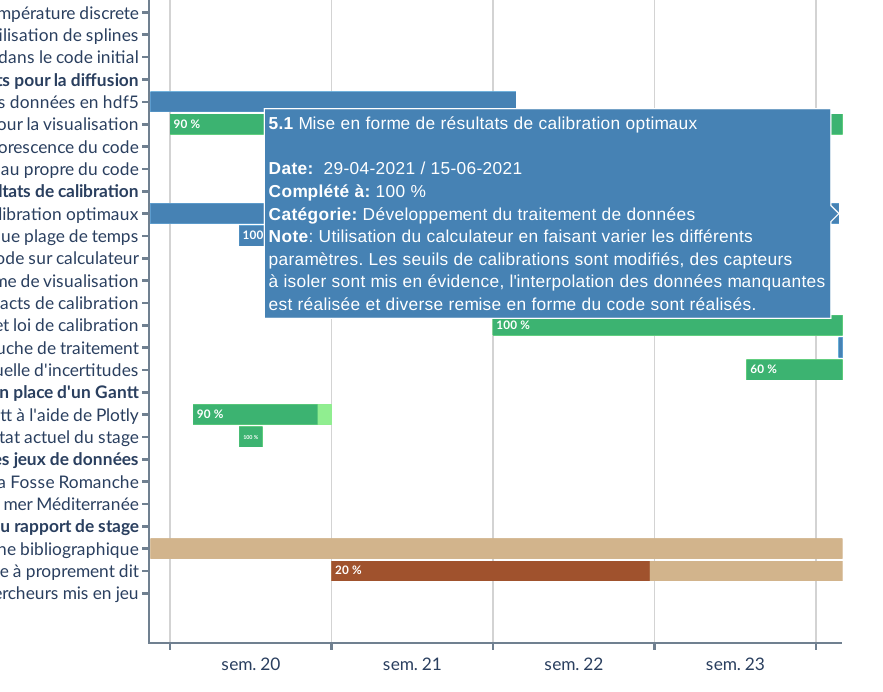
And a zoom view of the hover info possible :