chia-monitor
A monitoring tool to collect all important metrics from your Chia farming node and connected harvesters. It can send you push notifications with regular status updates and will alert you in case something goes wrong or a proof is found. All metrics are exported to a Prometheus compatible /metrics endpoint and a Grafana dashboard is also provided:
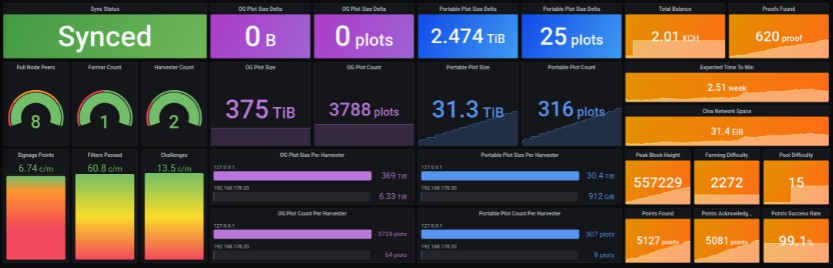
This example dashboard displays almost all collected metrics and can be imported from grafana.com using the ID 14544 or using the grafana/dashboard.json from this repository.
Notifications
To use notifications, please configure a status_service_url and alert_service_url for your desired notification service in the config.json. You can use most popular notifications services by creating a service specific webhook URL, following the instructions from this wiki. If you wish to disable notifications entirely, you can set the enable field in the notifications section of the config.json to false.
Following notifications are currently sent to the status_service_url:
Farm summary (configurable interval in config.json)
** ?? Farm Status ?? **
? OG Plot Count: 3797
? Portable Plot Count: 50
? OG Plot Size: 375.828 TiB
? Portable Plot Size: 4.948 TiB
? Plot Change 24h: +86 (+8.511 TiB)
⌛️ Signage Points Per Minute: 6.30
? Passed Filters Per Minute: 49.30
✅ Total Proofs found: 73
? Total Balance: 2.00001 XCH
?️ Time To Win: 2 weeks and 4 days
? Current Netspace: 30.706 EiB
?️ Peak Height: 544594
? Full Node Peer Count: 8
? Synced: True
Proof found alert
Triggers when a new partial or full proof is found. To limit the amount of notifications when pooling, this can be disabled in the config using the disable_proof_found_alert setting.
** ? Proof found! ? **
Your farm found a new partial or full proof
Following notifications are currently sent to the alert_service_url:
Sync lost alert
** ? Farmer Lost Sync! ? **
It seems like your farmer lost its connection to the Chia Network
Sync recovery alert
** ✅ Farmer Synced! ✅ **
Your farmer is successfully synced to the Chia Network again
Plots lost alert
Triggers when the total plot count of your farm drops below a configurable threshold (default: 1).
The corresponding lost_plots_alert_threshold parameter can be adjusted in the config.json.
** ? Farmer Lost Plots! ? **
It seems like your farmer lost some plots
Expected: 130, Found: 124
Plots recovery alert
** ✅ Farmer Plots recoverd! ✅ **
Your farmer's plot count has recovered to its previous value
Metrics
The following statistics are collected from your local Chia node using the RPC and WebSocket APIs and are then exported via a Prometheus compatible /metrics HTTP endpoint on port 8000.
Supported wallet metrics
- Total balance (
chia_confirmed_total_mojos)
Supported full node metrics
- Sync status (
chia_sync_status) - Peak height (
chia_peak_height) - Difficulty (
chia_diffculty) - Total netspace (
chia_network_space) - Connection count (
chia_connections_count)
Supported harvester metrics
- OG plot count (
chia_plot_count) - OG plot size (
chia_plot_size) - Portable plot count (
chia_portable_plot_count) - Portable plot size (
chia_portable_plot_size)
Supported farmer metrics
- Received signage points (
chia_signage_points) - Received signage point index (
chia_signage_point_index) - Attempted challenges (
chia_block_challenges) - Plots passed filter (
chia_plots_passed_filter) - Proofs found (
chia_proofs_found)
Supported pooling metrics
- Current Points (
chia_current_pool_points) - Current difficulty (
chia_current_pool_difficulty) - Points found (
chia_pool_points_found_since_start) - Points acknowledged (
chia_pool_points_acknowledged_since_start) - Pool errors 24h (
chia_num_pool_errors_24h)
Prerequisites
To run this tool, we need the following things:
- Python 3
- Pipenv
Linux (Ubuntu)
sudo apt install python3 pipenv
Installation
- Clone the repository
git clone https://github.com/philippnormann/chia-monitor.git
cd chia-monitor
- Install the required dependecies
pipenv install
- Initialize the SQLite database
pipenv run alembic upgrade head
- Copy the example config file
cp config-example.json config.json
- Open up
config.jsonand configure it to your preferences.
Updating
- Pull the latest release from git
cd chia-monitor
git reset origin/main --hard
git pull
- Update the required dependecies
pipenv install
- Upgrade the SQLite database model
pipenv run alembic upgrade head
Usage
To use the tool, run the monitor module using pipenv from the chia-monitor directory
cd chia-monitor
pipenv run python -m monitor
Note: To run the tool in the background, you can run it as a service or in a detached screen.
Basic Prometheus Configuration
Add a block to the scrape_configs of your prometheus.yml config file:
scrape_configs:
  - job_name: chia_monitor
    static_configs:
    - targets: ['<<CHIA-MONITOR-HOSTNAME>>:8000']
and adjust the host name accordingly.
Architecture


