Epymetheus: Multi-asset Backtesting Framework
Epymetheus is a multi-asset backtesting framework. It features an intuitive user API that lets analysts try out their trade strategies right away.
Installation
$ pip install epymetheus
Features
- Intuitive and Pythonic API
- Epymetheus designs Pythonic API that lets you code your idea intuitively without any fuss.
- Trading strategies can be readily coded as ordinary functions and then you can
run()andscore()it right away.
- Blazingly Fast Computation
- Backtesting is boosted by NumPy and so you can give your own idea a quick try.
- Executions of profit-taking and stop-loss orders are built-in.
- Seamless Connection with Pandas
- You can use
pandas.DataFrameof historical prices as the target of backtesting. - You can view the result of backtesting in Pandas format so that you can analyze and plot it using the familiar Pandas methods.
- You can use
- Full Test Coverage:
- Epymetheus is thoroughly tested by continuous integration with 100% code coverage.
Integrations
Your trading strategy may incorporate various libraries out there, for instance,
- Machine Learning - scikit-learn, PyTorch, TensorFlow, etc.
- Econometrics - statsmodels, Prophet, etc.
- Technical Indicators - TA-Lib, etc.
- Hyperparameter Optimization - Optuna (Example follows), etc.
How to use
Create strategy
Let's construct your trading strategy. The following "dumb strategy" will,
- target a set of stocks whose
DataFrameof historical prices is given byuniverse. - buy the cheapest stock with your monthly allowance $100, and
- place a profit-taking order when your profit exceeds $
profit_takeand place a stop-loss order when your loss exceeds $stop_loss.
Here in the function dumb_strategy, the first argument universe is mandatory while the other arguments are parameters that you can define freely.
import pandas as pd
import epymetheus as ep


def dumb_strategy(universe: pd.DataFrame, profit_take, stop_loss):
    # I get $100 allowance on the first business day of each month
    allowance = 100

    for date in pd.date_range(universe.index[0], universe.index[-1], freq="BMS"):
        cheapest_stock = universe.loc[date].idxmin()

        # Find the maximum number of shares that I can buy with my allowance
        n_shares = allowance // universe.at[date, cheapest_stock]

        trade = n_shares * ep.trade(cheapest_stock, date, take=profit_take, stop=stop_loss)
        yield trade
You can now create your strategy with specific parameters as:
my_strategy = ep.create_strategy(dumb_strategy, profit_take=20.0, stop_loss=-10.0)
Run strategy
Now you can backtest your strategy with any universe, for instance, US stocks.
from epymetheus.datasets import fetch_usstocks

universe = fetch_usstocks()
universe.head()
#                 AAPL       MSFT     AMZN  BRK-A        JPM        JNJ        WMT        BAC         PG        XOM
# 2000-01-01  0.785456  37.162327  76.1250  56100  27.773939  27.289129  46.962898  14.527933  31.304089  21.492596
# 2000-01-02  0.785456  37.162327  76.1250  56100  27.773939  27.289129  46.962898  14.527933  31.304089  21.492596
# 2000-01-03  0.855168  37.102634  89.3750  54800  26.053429  26.978193  45.391777  14.021359  30.625511  20.892334
# 2000-01-04  0.783068  35.849308  81.9375  52000  25.481777  25.990519  43.693306  13.189125  30.036228  20.492161
# 2000-01-05  0.794528  36.227283  69.7500  53200  25.324482  26.264877  42.801613  13.333860  29.464787  21.609318

my_strategy.run(universe)
# 240 trades returned: trade(['BAC'], lot=[3.], entry=2019-12-02 00:00:00, take=20.0, stop=-10.0) ... Done. (Runtume: 0.1034 sec)
# 240 trades executed: trade(['BAC'], lot=[3.], entry=2019-12-02 00:00:00, take=20.0, stop=-10.0) ... Done. (Runtime: 0.2304 sec)
# Done. (Runtime: 0.3338 sec)
Trade history and wealth
Trade history can be viewed as:
df_history = my_strategy.history()
df_history.head()
#    trade_id asset    lot      entry      close  exit  take  stop        pnl
# 0         0  AAPL  115.0 2000-01-03 2005-01-07  None  20.0 -10.0  23.527901
# 1         1  AAPL  129.0 2000-02-01 2000-09-29  None  20.0 -10.0 -48.437450
# 2         2  AAPL   99.0 2000-03-01 2005-07-14  None  20.0 -10.0  24.924913
# 3         3  AAPL   97.0 2000-04-03 2005-07-14  None  20.0 -10.0  22.180065
# 4         4  AAPL  104.0 2000-05-01 2005-05-19  None  20.0 -10.0  20.736752
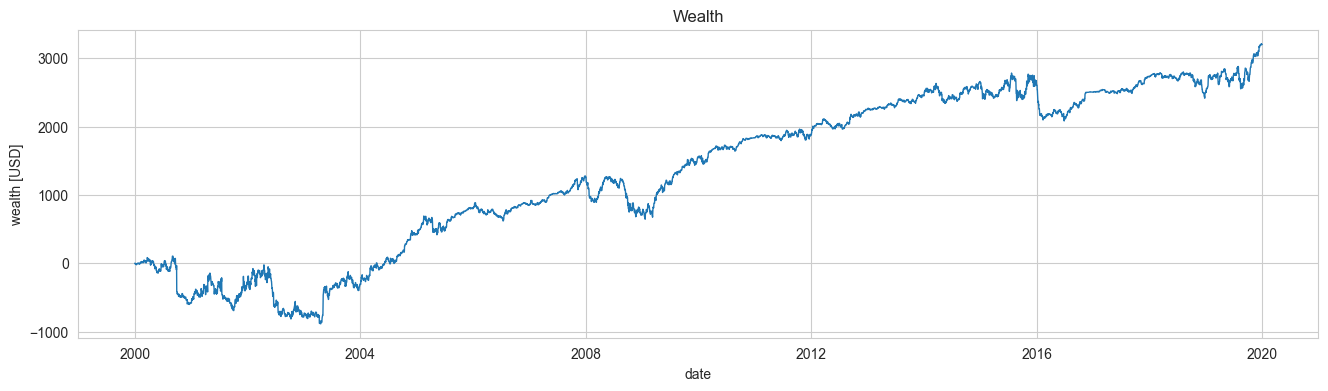
The time-series of wealth can be viewed as:
series_wealth = my_strategy.wealth()
series_wealth.head()
# 2000-01-01    0.000000
# 2000-01-02    0.000000
# 2000-01-03    0.000000
# 2000-01-04   -8.363557
# 2000-01-05   -7.034265
# Freq: D, dtype: float64
Scores
You can quickly score() the metrics of the strategy.
my_strategy.score("final_wealth")
# 3216.74
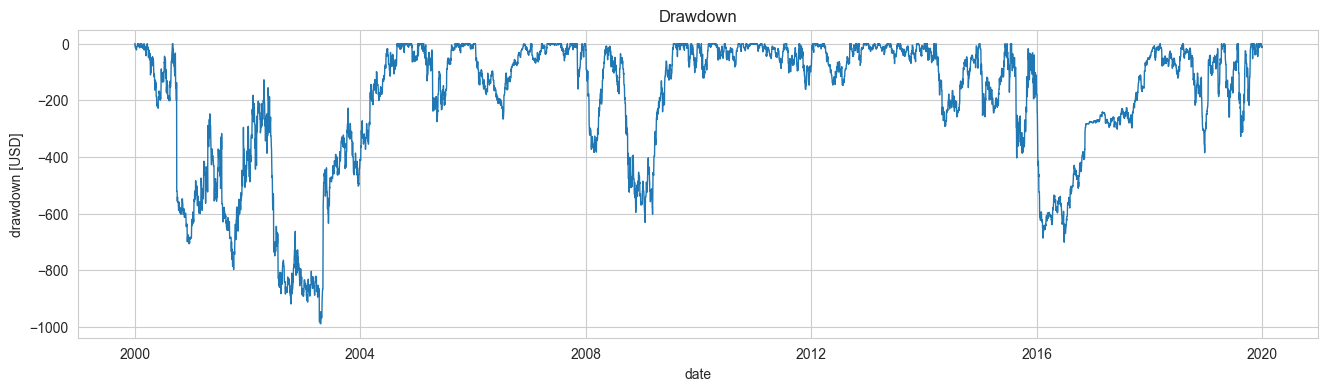
my_strategy.score("max_drawdown")
# -989.19
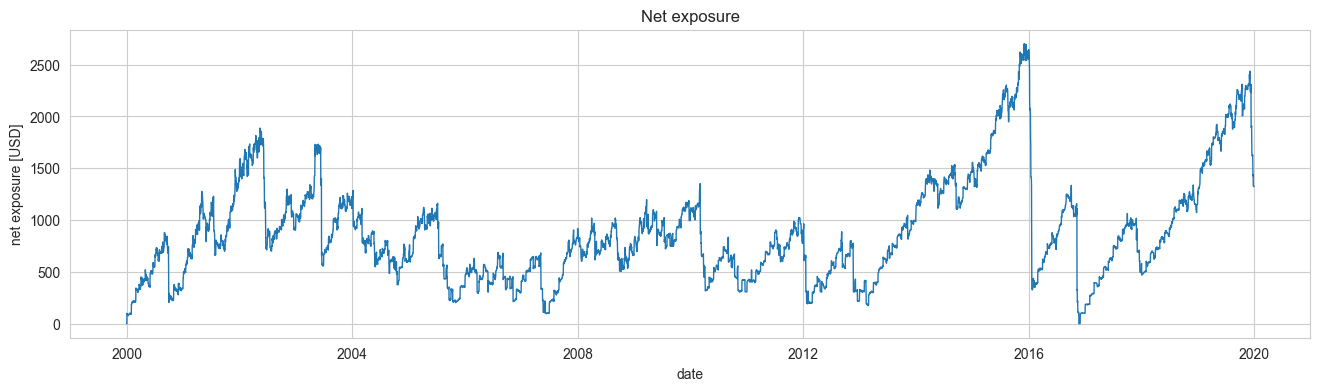
You may compute various time-series.
drawdown = my_strategy.drawdown()
exposure = my_strategy.net_exposure()
More examples
Optimization
You may optimize the parameters of your strategy using Optuna for example.
Remember that optimization for backtesting is dangerous.
import optuna


def objective(trial):
    profit_take = trial.suggest_int("profit_take", 10, 100)
    stop_loss = trial.suggest_int("stop_loss", -100, -10)

    my_strategy = ep.create_strategy(
        dumb_strategy,
        profit_take=profit_take,
        stop_loss=stop_loss,
    ).run(universe, verbose=False)

    return my_strategy.score("final_wealth")


study = optuna.create_study(direction="maximize")
study.optimize(objective, n_trials=100)

study.best_params
# {'profit_take': 100, 'stop_loss': -42}
Pair trading
Trade can include multiple stocks.
Profit-take and stop-loss will be executed when the total profit/loss exceed thresholds.
def pair_trading_strategy(universe, param_1, ...):
    ...
    # Buy 1 share of "BULLISH_STOCK" and sell 2 shares of "BEARISH_STOCK".
    yield [1, -2] * ep.trade(["BULLISH_STOCK", "BEARISH_STOCK"], stop=-100.0)


