visualize_1541
visualize_1541 is a tool that creates visualizations of the data layout on G64 Commodore 1541 disk images.
Circular
This representation is useful to visualize custom disk formats and differences in gap sizes.
-
Every track starts at the bottom and is drawn counter-clockwise.
-
Green represents the data. Darker areas have more 0-bits.
-
Red represents a longer sequence of 1-bits.
-
Blue represents a longer sequence of 0-bits.
python visualize_1541.py disk.g64 disk.png
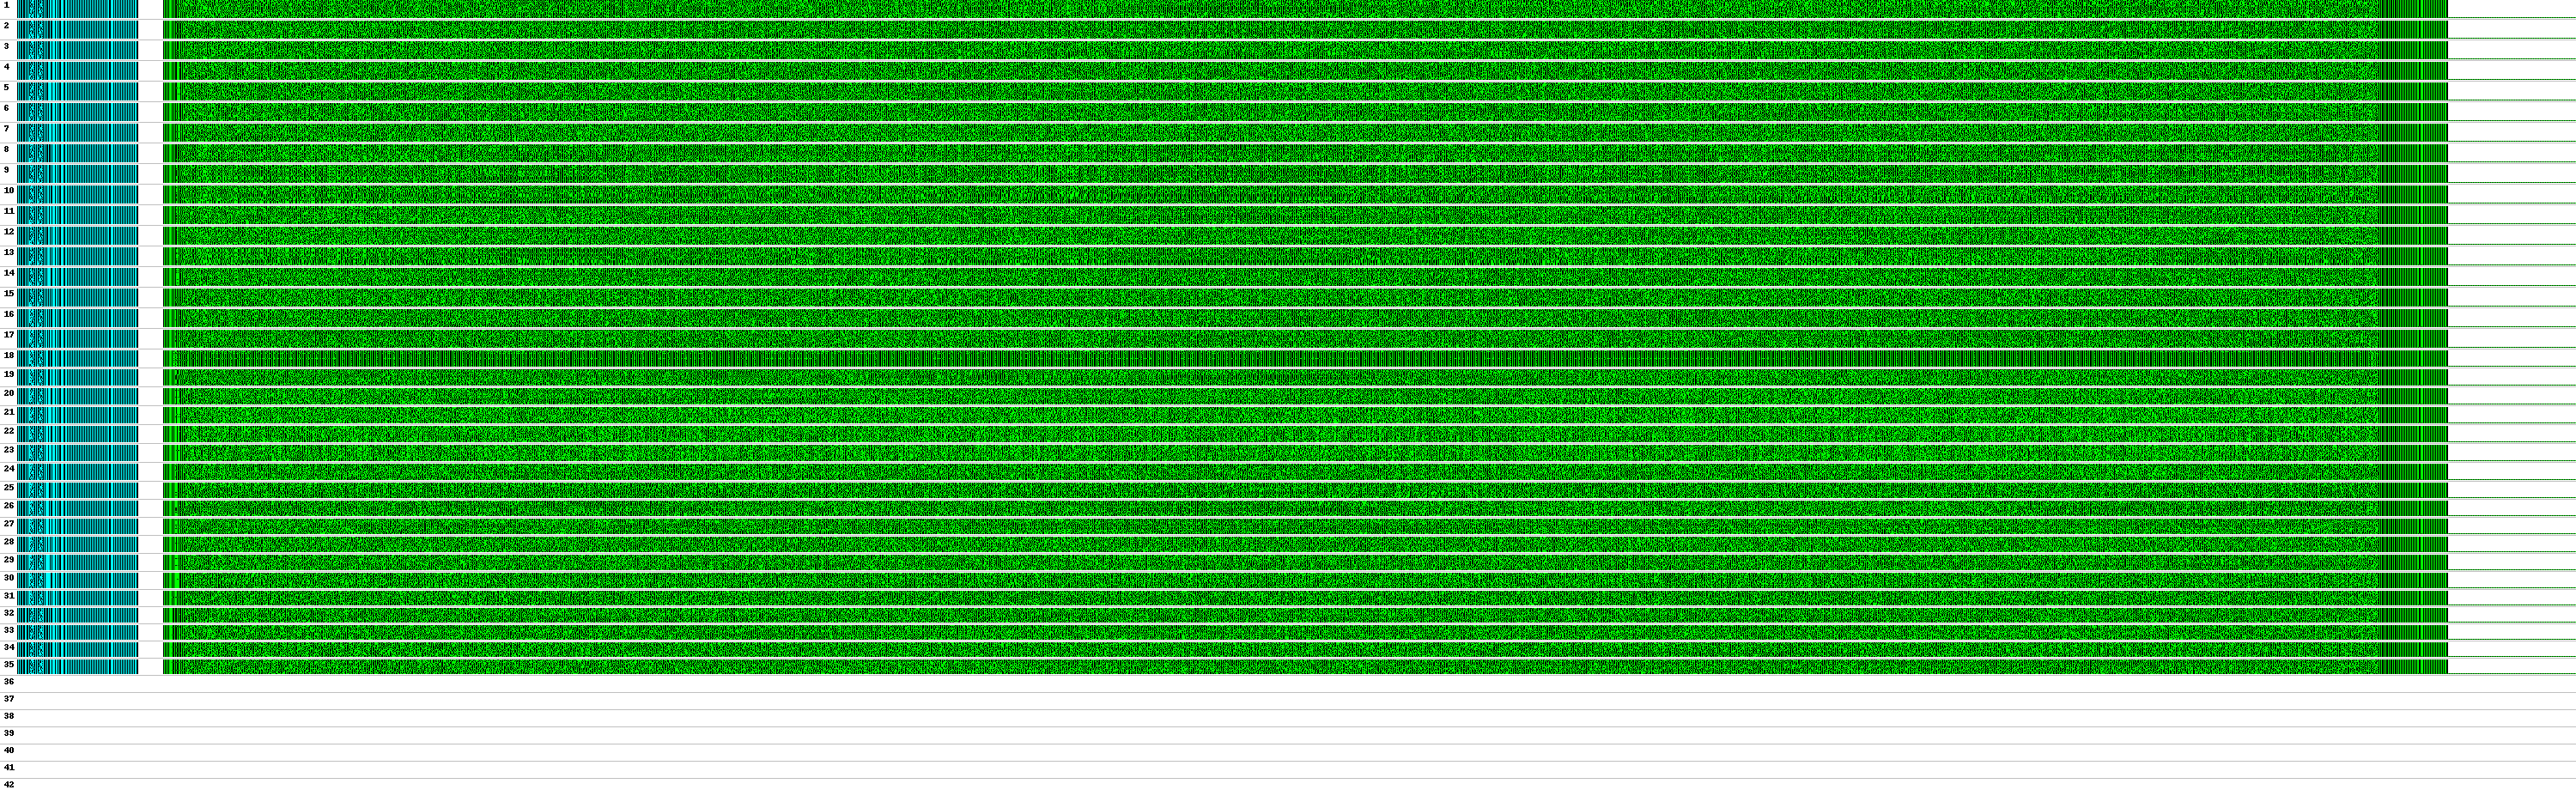
Sector-by-sector
This representation is useful to visualize errors on Commodore-formatted disks. The tool decodes SYNC marks and sector headers.
-
Every pack of 17-21 lines is a track, numbered 1-41.
-
Every line within a pack is one sector.
-
The raw sector contents are drawn from left to right.
-
The cyan part is the header, the green part the data.
-
Black is 0, cyan/green is 1.
-
White represents missing header or sector sections.
python visualize_1541_blocks.py disk.g64 disk.png
More Information
There are two articles about these tools:
Limitations
These are some limitations of the tool for the circular representation:
- Because the Pillow library cannot draw antialiased lines, the tool renders the image at 16x (!) the resolution and scales it down at the end. This uses a lot of memory, yet there are still Moiré artifacts. Using a different image library would be a good idea.
- Red areas (SYNCs marks) show up as soon as there are 8 1-bits. SYNC detection on the 1541 requires at least 10. (The sector-by-sector tool contains logic for correct SYNC detection that should be ported over.)
- The data area shows the GCR data. An option should be added to show the GCR-decoded data.
nibtool.nbzfiles are better suited as sources, the tool should be extended to support them.


