celluloid
Creating animations should be easy. This module makes it easy to adapt your existing visualization code to create an animation.
Install
pip install celluloid
Manual
Follow these steps:
- Create a matplotlib
Figureand create aCamerafrom it:
from celluloid import Camera
fig = plt.figure()
camera = Camera(fig)
- Reusing the figure and after each frame is created, take a snapshot with the camera.
plt.plot(...)
plt.fancy_stuff()
camera.snap()
- After all frames have been captured, create the animation.
animation = camera.animate()
animation.save('animation.mp4')
The entire module is less than 50 lines of code.
Examples
Minimal
As simple as it gets.
from matplotlib import pyplot as plt
from celluloid import Camera

fig = plt.figure()
camera = Camera(fig)
for i in range(10):
    plt.plot([i] * 10)
    camera.snap()
animation = camera.animate()
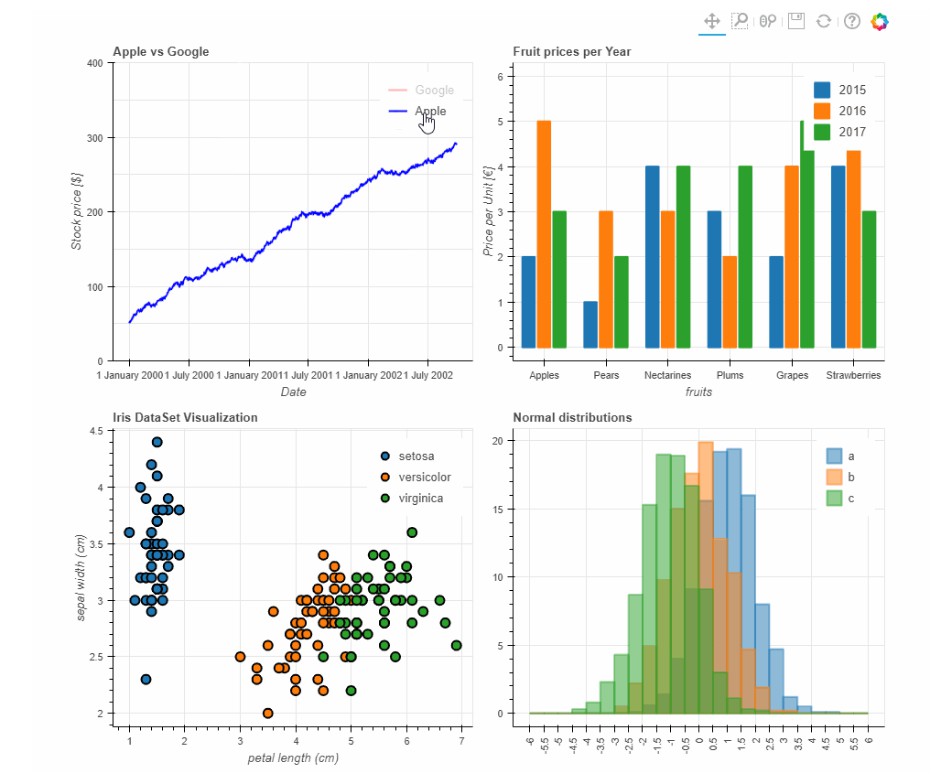
Subplots
Animation at the top.
import numpy as np
from matplotlib import pyplot as plt
from celluloid import Camera

fig, axes = plt.subplots(2)
camera = Camera(fig)
t = np.linspace(0, 2 * np.pi, 128, endpoint=False)
for i in t:
    axes[0].plot(t, np.sin(t + i), color='blue')
    axes[1].plot(t, np.sin(t - i), color='blue')
    camera.snap()
animation = camera.animate()
Images
Domain coloring example.
import numpy as np
from matplotlib import pyplot as plt
from matplotlib.colors import hsv_to_rgb

from celluloid import Camera

fig = plt.figure()
camera = Camera(fig)

for a in np.linspace(0, 2 * np.pi, 30, endpoint=False):
    x = np.linspace(-3, 3, 800)
    X, Y = np.meshgrid(x, x)
    x = X + 1j * Y
    y = (x ** 2 - 2.5) * (x - 2.5 * 1j) * (x + 2.5 * 1j) \
        * (x - 2 - 1j) ** 2 / ((x - np.exp(1j * a)) ** 2
        * (x - np.exp(1j * 2 * a)) ** 2)

    H = np.angle(y) / (2 * np.pi) + .5
    r = np.log2(1. + np.abs(y))
    S = (1. + np.abs(np.sin(2. * np.pi * r))) / 2.
    V = (1. + np.abs(np.cos(2. * np.pi * r))) / 2.

    rgb = hsv_to_rgb(np.dstack((H, S, V)))
    ax.imshow(rgb)
    camera.snap()
animation = camera.animate()
Legends
import matplotlib
from matplotlib import pyplot as plt
from celluloid import Camera

fig = plt.figure()
camera = Camera(fig)
for i in range(5):
    t = plt.plot(range(i, i + 5))
    plt.legend(t, [f'line {i}'])
    camera.snap()
animation = camera.animate()
Limitations
- The axes' limits should be the same for all plots. The limits of the animation will be the limits of the final plot.
- Legends will accumulate from previous frames. Pass the artists to the
legendfunction to draw them separately. - This can demand a lot of memory since it uses
ArtistAnimationunder the hood. This means that all artists are saved to memory before the animation is constructed. - This is a black box. If you want to understand how matplotlib animations work, using this library may hinder you. If you want to be an expert matplotlib user, you may want to pass on this library.