Lets-Plot
Lets-Plot is an open-source plotting library for statistical data. It is implemented using the Kotlin programming language.
The design of Lets-Plot library is heavily influenced by Leland Wilkinson work The Grammar of Graphics describing the deep features that underlie all statistical graphics.
This grammar [...] is made up of a set of independent components that can be composed in many different ways. This makes [it] very powerful because you are not limited to a set of pre-specified graphics, but you can create new graphics that are precisely tailored for your problem.
Hadley Wickham, "ggplot2: Elegant Graphics for Data Analysis"
Due to the unique multi-platform nature of Kotlin programming language, you can obtain the plotting functionality that is packaged as a JavaScript library, JVM library, and a native Python extension.
Lets-Plot for Python
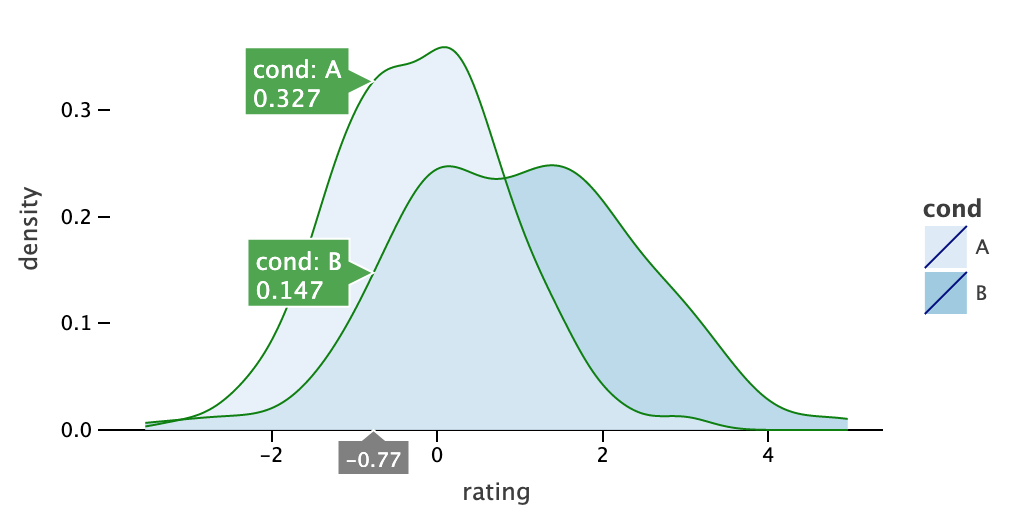
The Lets-Plot for Python package offers a ggplot-like API for data visualization in Jupyter notebooks as well as in other notebooks like Datalore, Kaggle or Colab.
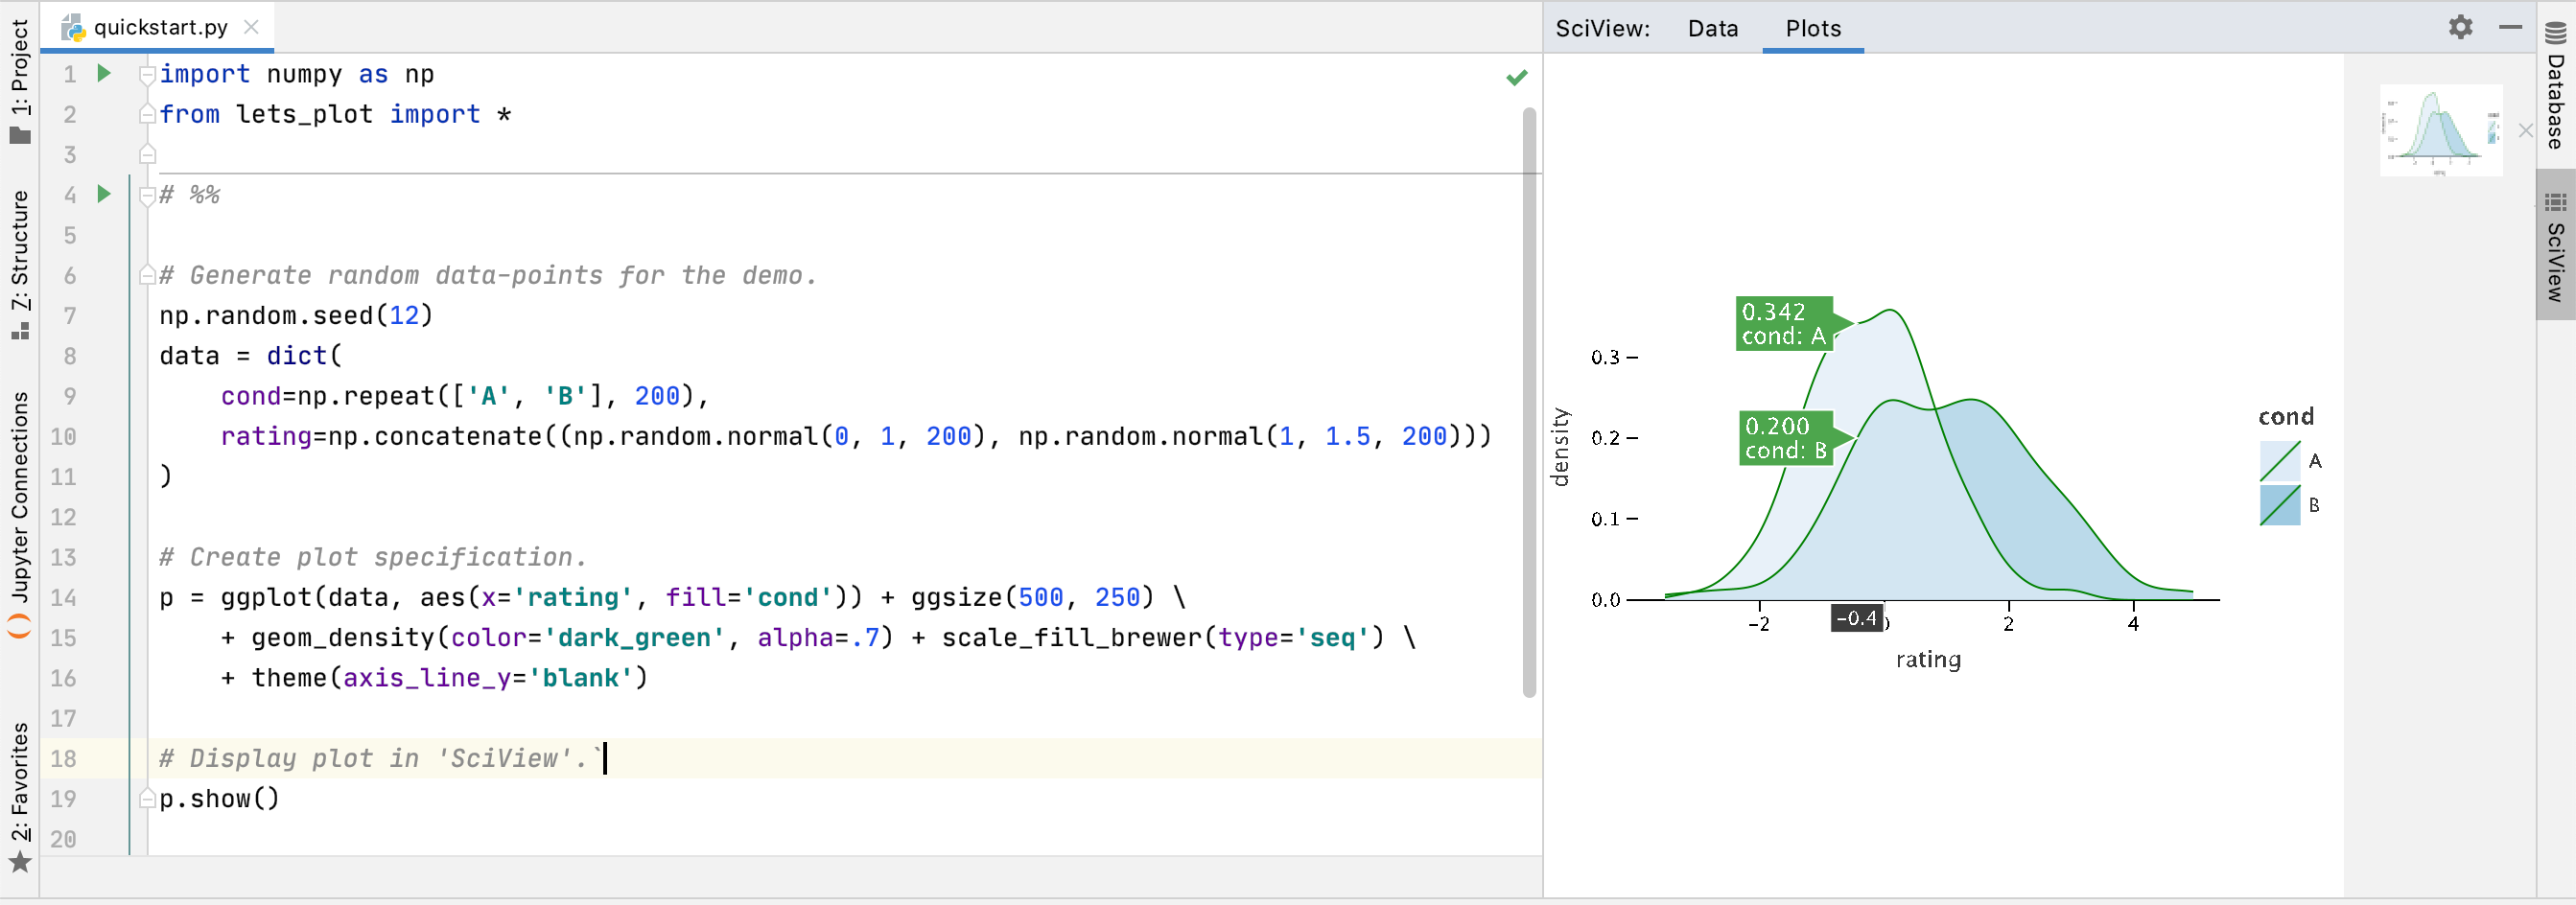
You can even create plots using Python editor in PyCharm or IntelliJ IDEA (Scientific mode, the Lets-Plot in SciView plugin is required).
Read README_PYTHON.md to learn more about the package installation and usage.
Check out documentation on-line at https://lets-plot.org.
JVM, Kotlin/JS artifacts and Kotlin API
Lets-Plot Kotlin API adds Grammar-of-Graphics plotting capabilities to Kotlin kernels for Jupyter notebooks.
Apart from Jupyter notebooks, Lets-Plot Kotlin API enables embedding plots into JVM and Kotlin/JS applications.
To learn more about embedding plots into JVM and Kotlin/JS apps see README_DEV.md in the Lets-Plot Kotlin project on GitHub.
"Lets-Plot in SciView" plugin for IntelliJ IDEA and PyCharm
The plugin adds support for interactive plots in IntelliJ-based IDEs with the enabled Scientific mode.
The Scientific mode in PyCharm and in IntelliJ IDEA Python plugin provides support for interactive scientific computing and data visualization.