charts.css.py
As implied by its name, charts.css.py brings charts.css to Python.
Charts.css is a pure-CSS data visualization framework. It offers advantages over traditional JS-heavy chart libraries.
charts.css.py provides a pythonic API on top of charts.css, so that you can largely avoid working directly at HTML and CSS level.
Installation
pip install charts.css.py
Usage
charts.css.py process data by converting your 2-dimension number list into an HTML table, which is properly styled with CSS classes.
Then you write such a string into your HTML page, together with
<link rel="stylesheet" href="https://cdn.jsdelivr.net/npm/charts.css/dist/charts.min.css">,
the visual representation will be rendered by browser.
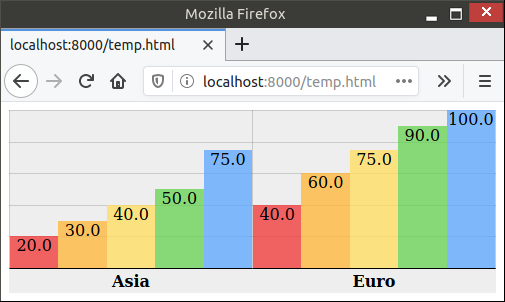
For example, the following code snippet can convert a 2-dimension list into column chart:
    from charts.css import column, STYLESHEET
    chart = column(
        [
            ["Continent", "1st year", "2nd year", "3rd year", "4th year", "5th year"],
            ["Asia", 20.0, 30.0, 40.0, 50.0, 75.0],
            ["Euro", 40.0, 60.0, 75.0, 90.0, 100.0],
        ],
        headers_in_first_row=True,
        headers_in_first_column=True,
        )
    # Now, variable chart contains html snippet of "<table>...</table>", and
    # STYLESHEET is just a constant string of "<link href='https://.../charts.css'>".
    # You can somehow insert them into the proper places of your full html page.
    # Here in this sample, we take a shortcut by simply concatenating them.
    open("output.html", "w").write(STYLESHEET + chart)
The output.html will be rendered in browser like this:

Advanced Usage
There are currently 4 different charts implemented: bar, column, line, area.
All those methods support these parameters
to further customize the chart appearance.
bar() and column() also support two extra parameters:
stacked: boolean and percentage: boolean.
There is another experimental helper wrapper(...) which can be used to:
- customize the display position of legend
(you would need to use your HTML and CSS skill for this) - potentially mixed multiple charts and overlay them together.
Please read the
unit test
for more examples.
Lastly, this package also provides a command-line tool csv2chart.
You can use it to convert csv file into an html file.
For example, csv2chart sample.csv output.html.
You can also run csv2chart -h to know all the parameters it supports.


