ecal_mongraph
Display ecal monitoring information as graph.
Dependencies
Pip install ‘matplotlib’ and ‘networkx’.
How to use
Start a few samples from the samples folder and then execute ‘ecal_mongraph.py’. The result should look like this ..
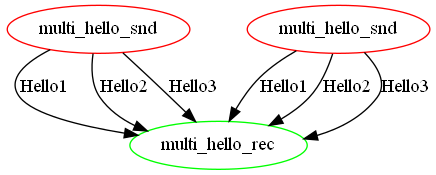
Display ecal monitoring information as graph.
Pip install ‘matplotlib’ and ‘networkx’.
Start a few samples from the samples folder and then execute ‘ecal_mongraph.py’. The result should look like this ..


