cairocore
cairocore provides a canvas and tools for fast 2d drawing operations.
It provides a low-level wrapper around the cariographics 2D graphics library (written in C) which provides drawing operations and related functions, with consistent output on multiple platforms and output media (e.g. SVG, PDF, PNG etc).
This package is not a graphics device - you can’t plot to it. Instead it provides a canvas for directly drawing shapes and text.
Key Features
- Very fast line and shape drawing
- Convert canvas surface to/from R arrays - this means you can draw on
an array from within R - Alpha-blending and anti-aliasing
- Direct control of what pixels get put on a canvas i.e. not having to
pass through an intermediate plotting step (e.g. ggplot) or graphics
device (e.g. png())
Package Philosophy
cairocore is a one-to-one mapping from R functions to C functions in
the cariographics C library.
This package will remain very “C-like”, but other packages are welcome
to wrap this cairocore to enable more idiomatic R programming styles.
One such wrapper is
cairobasic which offers
a subset of the possible drawing operations with a friendlier interface.
Installation Pre-requisite: Cairographics C library + headers
CairoGraphicslibrary installed- See CairoGraphics downloads
page for more information
on how this might work on your platform.
Install CairoGraphics on Mac OSX
Install CairoGraphics on Linux
- Debian/Ubuntu -
sudo apt-get install libcairo2-dev - Fedora -
sudo yum install cairo-devel - openSUSE -
zypper install cairo-devel
Install CairoGraphics on Windows
I haven’t been able to test any of the windows techniques - if you are a
windows user, please let me know what worked for you!
- CairoGraphics downloads
page for more information - Try the following:
Installation
You can install from
GitHub with:
# install.package('remotes')
remotes::install_github('coolbutuseless/cairocore')
Documentation + Tutorials
cairocore behaves almost identically to the CairoGraphics C library
and in many cases examples from the internet (which are all in C code)
may be lightly modified and used as R code.
The documentation for cairocore is mostly a direct translation of the
CairoGraphics documentation
and has been extracted from the C source files.
View the online documentation
here
A great tutorial on using CairoGraphics in C is from
zetcode.
Vignettes
I’ve tried to highlight a few interesting features of CairoGrapihcs in
the vignettes, but the library is huge and I can’t cover all of it here.
Hopefully there are enough code examples to get you started!
- Creating
patterns - Drawing on R
arrays
create a drawing canvas from an R array and draw on it - Drawing simple
shapes - Image output
formats - Using
Transforms
by default CairoGraphics considers the origin to be the top left of
the page. This vignette sets the transformation matrix on a surface
such that the bottom left corner is considered the origin. - Vectorised
functions
there are some custom functions for drawing multitudes of the same
type of element. There is a speed advantage in looping over data
within C rather than within R. - Technical - enums in
C - Technical - pointers in
C - Technical - structs in
C
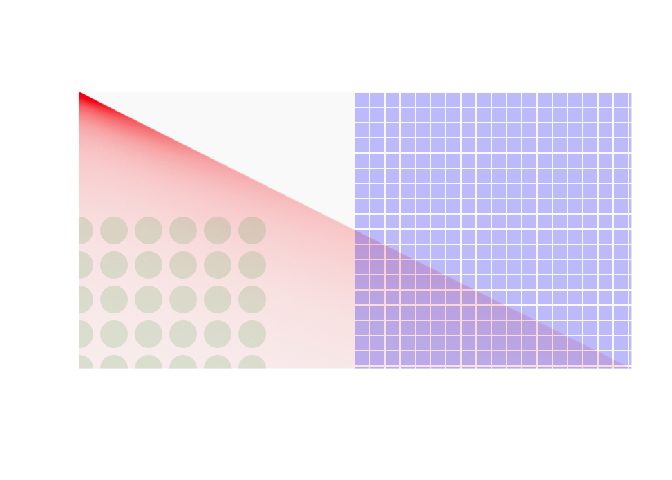
Example - Using cairocore as a drawing canvas
library(cairocore)

#~~~~~~~~~~~~~~~~~~~~~~~~~~~~~~~~~~~~~~~~~~~~~~~~~~~~~~~~~~~~~~~~~~~~~~~~~~~~~
# Create a surface to draw on.
#~~~~~~~~~~~~~~~~~~~~~~~~~~~~~~~~~~~~~~~~~~~~~~~~~~~~~~~~~~~~~~~~~~~~~~~~~~~~~
width  <- 800
height <- 400

surface <- cairo_image_surface_create(
  format = cairo_format_t$CAIRO_FORMAT_ARGB32,
  width  = width,
  height = height
)

#~~~~~~~~~~~~~~~~~~~~~~~~~~~~~~~~~~~~~~~~~~~~~~~~~~~~~~~~~~~~~~~~~~~~~~~~~~~~~
# Every surface must have a context in order to operate on it.
# For faster operation, antialiasing can be switched off
#~~~~~~~~~~~~~~~~~~~~~~~~~~~~~~~~~~~~~~~~~~~~~~~~~~~~~~~~~~~~~~~~~~~~~~~~~~~~~
cr <- cairo_create(surface)

#~~~~~~~~~~~~~~~~~~~~~~~~~~~~~~~~~~~~~~~~~~~~~~~~~~~~~~~~~~~~~~~~~~~~~~~~~~~~~
# Clear the surface to a light grey
#~~~~~~~~~~~~~~~~~~~~~~~~~~~~~~~~~~~~~~~~~~~~~~~~~~~~~~~~~~~~~~~~~~~~~~~~~~~~~
cairo_set_source_rgb(cr, 0.98, 0.98, 0.98)
cairo_paint(cr)

#~~~~~~~~~~~~~~~~~~~~~~~~~~~~~~~~~~~~~~~~~~~~~~~~~~~~~~~~~~~~~~~~~~~~~~~~~~~~~
# Draw some red lines
#~~~~~~~~~~~~~~~~~~~~~~~~~~~~~~~~~~~~~~~~~~~~~~~~~~~~~~~~~~~~~~~~~~~~~~~~~~~~~
cairo_set_source_rgba(cr, 1, 0, 0, 0.02)
for (i in seq(width)) {
  cairo_move_to(cr, 0, 0)
  cairo_line_to(cr, i, height)
  cairo_stroke(cr)
}

#~~~~~~~~~~~~~~~~~~~~~~~~~~~~~~~~~~~~~~~~~~~~~~~~~~~~~~~~~~~~~~~~~~~~~~~~~~~~~
# Draw some rectangles
#~~~~~~~~~~~~~~~~~~~~~~~~~~~~~~~~~~~~~~~~~~~~~~~~~~~~~~~~~~~~~~~~~~~~~~~~~~~~~
cairo_set_line_width(cr, 0.5)
cairo_set_source_rgba(cr, 0, 0, 1, 0.2)

for (j in seq(1, height, 22)) {
  for (i in seq(width/2, width, 22)) {
    cairo_rectangle(cr, i, j, 20, 20)
    cairo_fill(cr)
  }
}


#~~~~~~~~~~~~~~~~~~~~~~~~~~~~~~~~~~~~~~~~~~~~~~~~~~~~~~~~~~~~~~~~~~~~~~~~~~~~~
# Draw green circles
#~~~~~~~~~~~~~~~~~~~~~~~~~~~~~~~~~~~~~~~~~~~~~~~~~~~~~~~~~~~~~~~~~~~~~~~~~~~~~
for (x in seq(1, width/3, 50)) {
  for (y in seq(height/2, height, 50)) {
    cairo_set_source_rgba(cr, 0, 0.5, 0, 0.1)
    cairo_arc(cr, x, y, radius = 20, 0, 2*pi)
    cairo_fill(cr)
  }
}

#~~~~~~~~~~~~~~~~~~~~~~~~~~~~~~~~~~~~~~~~~~~~~~~~~~~~~~~~~~~~~~~~~~~~~~~~~~~~~
# Get the image surface as a raster
#~~~~~~~~~~~~~~~~~~~~~~~~~~~~~~~~~~~~~~~~~~~~~~~~~~~~~~~~~~~~~~~~~~~~~~~~~~~~~
raster_out <- cairo_image_surface_get_raster(surface, nchannel = 3)
plot(raster_out, interpolate = FALSE)

#~~~~~~~~~~~~~~~~~~~~~~~~~~~~~~~~~~~~~~~~~~~~~~~~~~~~~~~~~~~~~~~~~~~~~~~~~~~~~
# Save the surface as a PNG
#~~~~~~~~~~~~~~~~~~~~~~~~~~~~~~~~~~~~~~~~~~~~~~~~~~~~~~~~~~~~~~~~~~~~~~~~~~~~~
cairo_surface_write_to_png(surface, tempfile(fileext = ".png"))
#> [1] 0
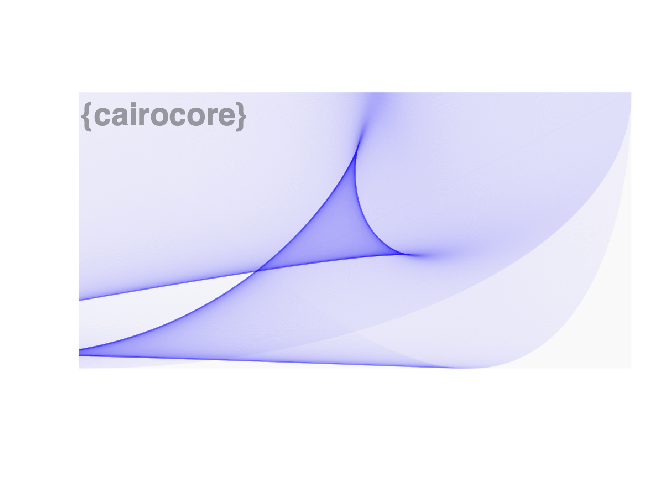
Example - drawing 10,000 alpha blended lines

library(cairocore)

#~~~~~~~~~~~~~~~~~~~~~~~~~~~~~~~~~~~~~~~~~~~~~~~~~~~~~~~~~~~~~~~~~~~~~~~~~~~~~
# Calculate the end coordinates of a lot of line segments
#~~~~~~~~~~~~~~~~~~~~~~~~~~~~~~~~~~~~~~~~~~~~~~~~~~~~~~~~~~~~~~~~~~~~~~~~~~~~~
width  <- 1000
height <- 500
N      <- 10000
t      <- seq(0, 2*pi, length.out = N)
x1     <- width  * sin(t)
x2     <- width  * sin(2 * t + pi/2)
y1     <- height * cos(t)
y2     <- height * cos(4*t + pi/2)


#~~~~~~~~~~~~~~~~~~~~~~~~~~~~~~~~~~~~~~~~~~~~~~~~~~~~~~~~~~~~~~~~~~~~~~~~~~~~~
# Create a surface to draw on.
#~~~~~~~~~~~~~~~~~~~~~~~~~~~~~~~~~~~~~~~~~~~~~~~~~~~~~~~~~~~~~~~~~~~~~~~~~~~~~
surface <- cairo_image_surface_create(
  format = cairo_format_t$CAIRO_FORMAT_ARGB32,
  width  = width,
  height = height
)

#~~~~~~~~~~~~~~~~~~~~~~~~~~~~~~~~~~~~~~~~~~~~~~~~~~~~~~~~~~~~~~~~~~~~~~~~~~~~~
# Every surface must have a context in order to operate on it.
# For faster operation, antialiasing can be switched off
#~~~~~~~~~~~~~~~~~~~~~~~~~~~~~~~~~~~~~~~~~~~~~~~~~~~~~~~~~~~~~~~~~~~~~~~~~~~~~
cr <- cairo_create(surface)
# cairo_set_antialias(cr, cairo_antialias_t$CAIRO_ANTIALIAS_NONE)

#~~~~~~~~~~~~~~~~~~~~~~~~~~~~~~~~~~~~~~~~~~~~~~~~~~~~~~~~~~~~~~~~~~~~~~~~~~~~~
# Clear the surface to a light grey
#~~~~~~~~~~~~~~~~~~~~~~~~~~~~~~~~~~~~~~~~~~~~~~~~~~~~~~~~~~~~~~~~~~~~~~~~~~~~~
cairo_set_source_rgb(cr, 0.98, 0.98, 0.98)
cairo_paint(cr)

#~~~~~~~~~~~~~~~~~~~~~~~~~~~~~~~~~~~~~~~~~~~~~~~~~~~~~~~~~~~~~~~~~~~~~~~~~~~~~
# Set the drawing colour for subsequent operations
#~~~~~~~~~~~~~~~~~~~~~~~~~~~~~~~~~~~~~~~~~~~~~~~~~~~~~~~~~~~~~~~~~~~~~~~~~~~~~
cairo_set_source_rgba(cr, 0.2, 0.3, 1, 0.01)

#~~~~~~~~~~~~~~~~~~~~~~~~~~~~~~~~~~~~~~~~~~~~~~~~~~~~~~~~~~~~~~~~~~~~~~~~~~~~~
# Draw each line -
#   this seems laborious but it is idiomatic C/cairo programming style
#~~~~~~~~~~~~~~~~~~~~~~~~~~~~~~~~~~~~~~~~~~~~~~~~~~~~~~~~~~~~~~~~~~~~~~~~~~~~~
for (i in seq(N)) {
  cairo_move_to(cr, x1[i], y1[i])
  cairo_line_to(cr, x2[i], y2[i])
  cairo_stroke(cr)
}

#~~~~~~~~~~~~~~~~~~~~~~~~~~~~~~~~~~~~~~~~~~~~~~~~~~~~~~~~~~~~~~~~~~~~~~~~~~~~~
# Write some text on the cairo surface
# `cairo_font_slant_t` and `cairo_font_weight_t` are enums in C which have
# been encoded as lists in R.
#~~~~~~~~~~~~~~~~~~~~~~~~~~~~~~~~~~~~~~~~~~~~~~~~~~~~~~~~~~~~~~~~~~~~~~~~~~~~~
cairo_select_font_face (
  cr,
  family = "sans",
  slant  = cairo_font_slant_t$CAIRO_FONT_SLANT_NORMAL,
  weight = cairo_font_weight_t$CAIRO_FONT_WEIGHT_BOLD
)

cairo_set_font_size(cr, 57.0)
cairo_set_source_rgba(cr, 0, 0, 0, 0.3)
cairo_move_to (cr, 5.0, 60.0)
cairo_show_text (cr, "{cairocore}")

#~~~~~~~~~~~~~~~~~~~~~~~~~~~~~~~~~~~~~~~~~~~~~~~~~~~~~~~~~~~~~~~~~~~~~~~~~~~~~
# Get the image surface as a raster
#~~~~~~~~~~~~~~~~~~~~~~~~~~~~~~~~~~~~~~~~~~~~~~~~~~~~~~~~~~~~~~~~~~~~~~~~~~~~~
raster_out <- cairo_image_surface_get_raster(surface, nchannel = 3)
plot(raster_out, interpolate = FALSE)
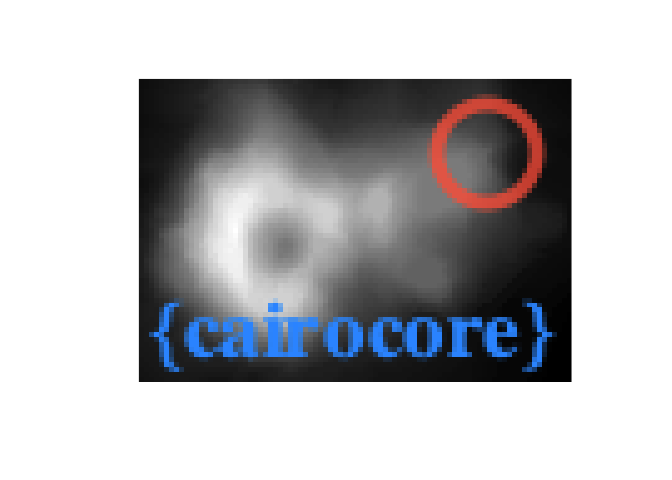
Example - taking an array in R, drawing on it, returning it to R
library(cairocore)
#~~~~~~~~~~~~~~~~~~~~~~~~~~~~~~~~~~~~~~~~~~~~~~~~~~~~~~~~~~~~~~~~~~~~~~~~~~~~~
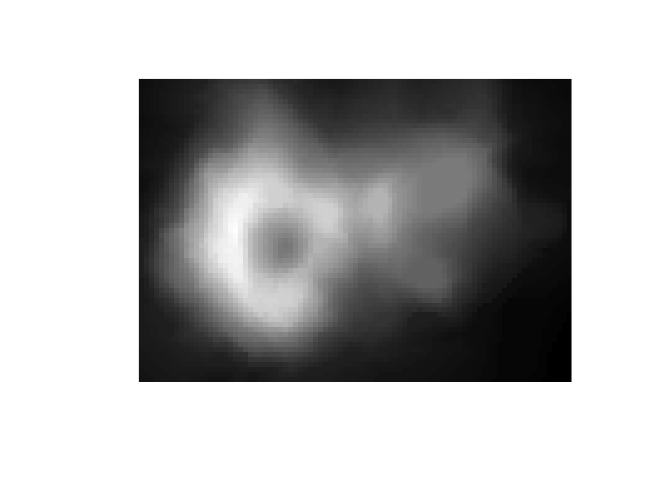
# Let's grab the volcano
#~~~~~~~~~~~~~~~~~~~~~~~~~~~~~~~~~~~~~~~~~~~~~~~~~~~~~~~~~~~~~~~~~~~~~~~~~~~~~
arr <- (t(volcano) - min(volcano))/(max(volcano) - min(volcano))
plot(as.raster(arr), interpolate = FALSE)
#~~~~~~~~~~~~~~~~~~~~~~~~~~~~~~~~~~~~~~~~~~~~~~~~~~~~~~~~~~~~~~~~~~~~~~~~~~~~~
# Initialise a surface from the array
#~~~~~~~~~~~~~~~~~~~~~~~~~~~~~~~~~~~~~~~~~~~~~~~~~~~~~~~~~~~~~~~~~~~~~~~~~~~~~
surface <- cairo_image_surface_create_from_array(arr)
cr      <- cairo_create(surface)

#~~~~~~~~~~~~~~~~~~~~~~~~~~~~~~~~~~~~~~~~~~~~~~~~~~~~~~~~~~~~~~~~~~~~~~~~~~~~~
# Draw a circle on the cairo surface
#~~~~~~~~~~~~~~~~~~~~~~~~~~~~~~~~~~~~~~~~~~~~~~~~~~~~~~~~~~~~~~~~~~~~~~~~~~~~~
cairo_arc(cr, 70, 15, 10, 0, 2*pi)
cairo_set_line_width(cr, 3);
cairo_set_source_rgba(cr, 255/255, 99/255, 71/255, 0.8)
cairo_stroke(cr)

#~~~~~~~~~~~~~~~~~~~~~~~~~~~~~~~~~~~~~~~~~~~~~~~~~~~~~~~~~~~~~~~~~~~~~~~~~~~~~
# Write some text on the cairo surface
#~~~~~~~~~~~~~~~~~~~~~~~~~~~~~~~~~~~~~~~~~~~~~~~~~~~~~~~~~~~~~~~~~~~~~~~~~~~~~
cairo_select_font_face (cr, "serif", cairo_font_slant_t$CAIRO_FONT_SLANT_NORMAL, cairo_font_weight_t$CAIRO_FONT_WEIGHT_BOLD)
cairo_set_font_size (cr, 17.0)
cairo_set_source_rgb (cr, 0.2, 0.6, 1.0)
cairo_move_to (cr, 2.0, 56.0)
cairo_show_text (cr, "{cairocore}")

#~~~~~~~~~~~~~~~~~~~~~~~~~~~~~~~~~~~~~~~~~~~~~~~~~~~~~~~~~~~~~~~~~~~~~~~~~~~~~
# Fetch the drawing surface as an array
#~~~~~~~~~~~~~~~~~~~~~~~~~~~~~~~~~~~~~~~~~~~~~~~~~~~~~~~~~~~~~~~~~~~~~~~~~~~~~
array_out <- cairo_image_surface_get_array(surface=surface)
plot(as.raster(array_out), interpolate = FALSE)

Related Software
- The R Cairo package uses
the CairoGraphics library internally to provide graphics output
devices for plotting. - The R cairoDevice
package appears to be almost identical to the{Cairo}package in
that it provides graphics output devices for plotting.
Acknowledgements
- R Core for developing and maintaining R
- CRAN maintainers, for patiently shepherding packages onto CRAN and
maintaining the repository


