ggsankey
The goal of ggsankey is to make beautiful sankey, alluvial and sankey
bump plots in ggplot2
Installation
You can install the development version of ggsankey from github with:
# install.packages("devtools")
devtools::install_github("davidsjoberg/ggsankey")
How does it work
Google
defines a sankey as:
A sankey diagram is a visualization used to depict a flow from one
set of values to another. The things being connected are called nodes
and the connections are called links. Sankeys are best used when you
want to show a many-to-many mapping between two domains or multiple
paths through a set of stages.
To plot a sankey diagram with ggsankey each observation has a stage
(called a discrete x-value in ggplot) and be part of a node.
Furthermore, each observation needs to have instructions of which node
it will belong to in the next stage. See the image below for some
clarification.
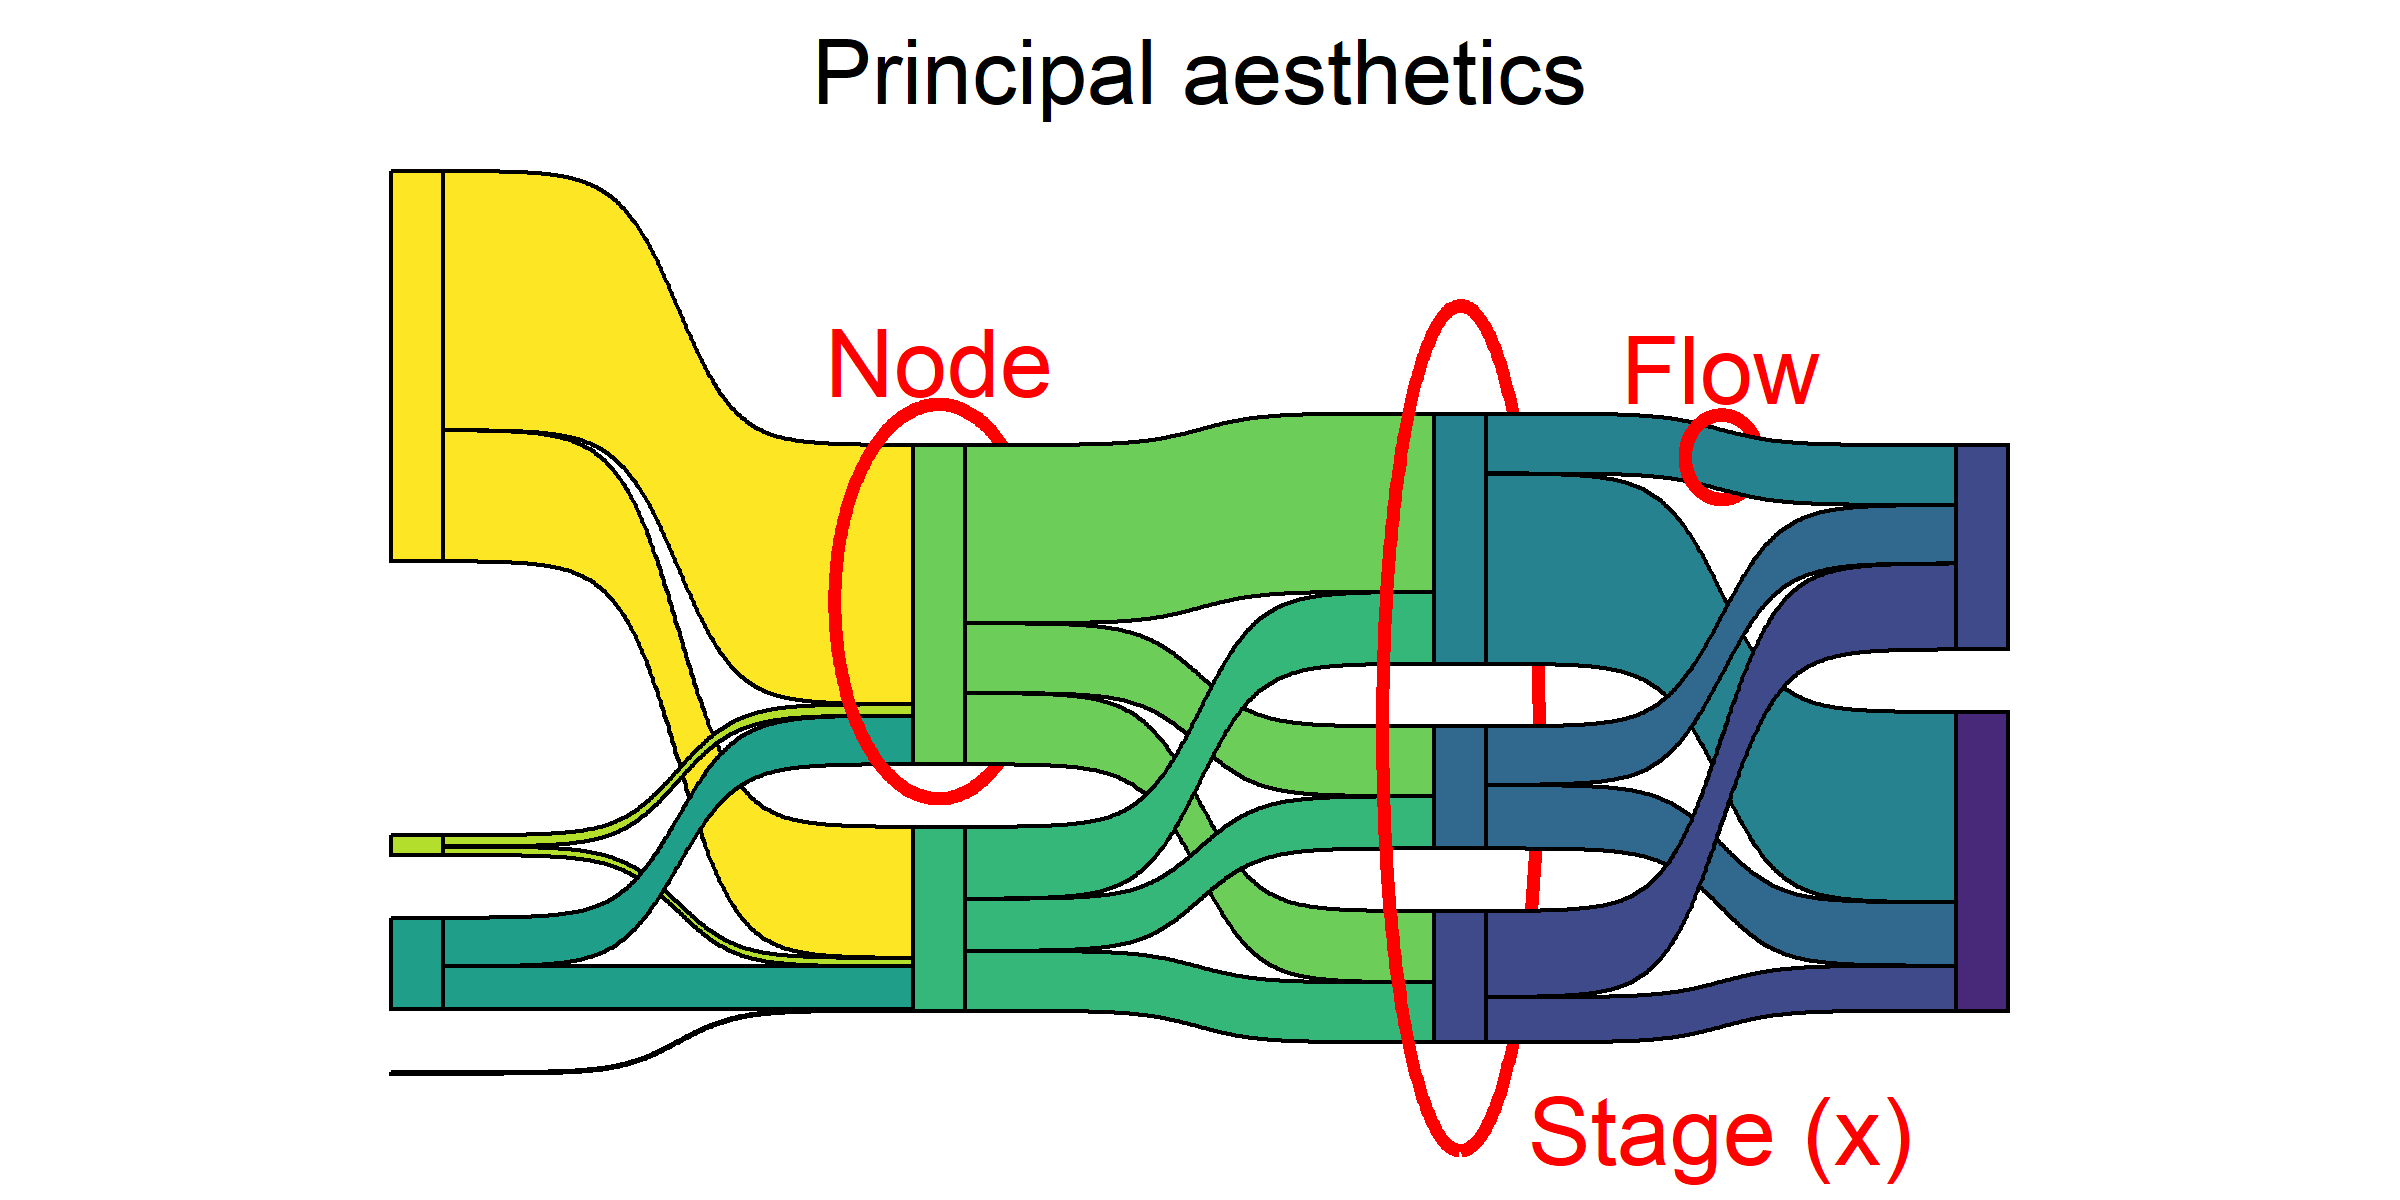
Hence, to use geom_sankey the aestethics x, next_x, node and
next_node are required. The last stage should point to NA. The
aestethics fill and color will affect both nodes and flows.
To plot a sankey diagram with ggsankey each observation has a stage
(called a discrete x-value in ggplot) and be part of a node.
Furthermore, each observation needs to have instructions of which node
it will belong to in the next stage. See the image below for some
clarification.
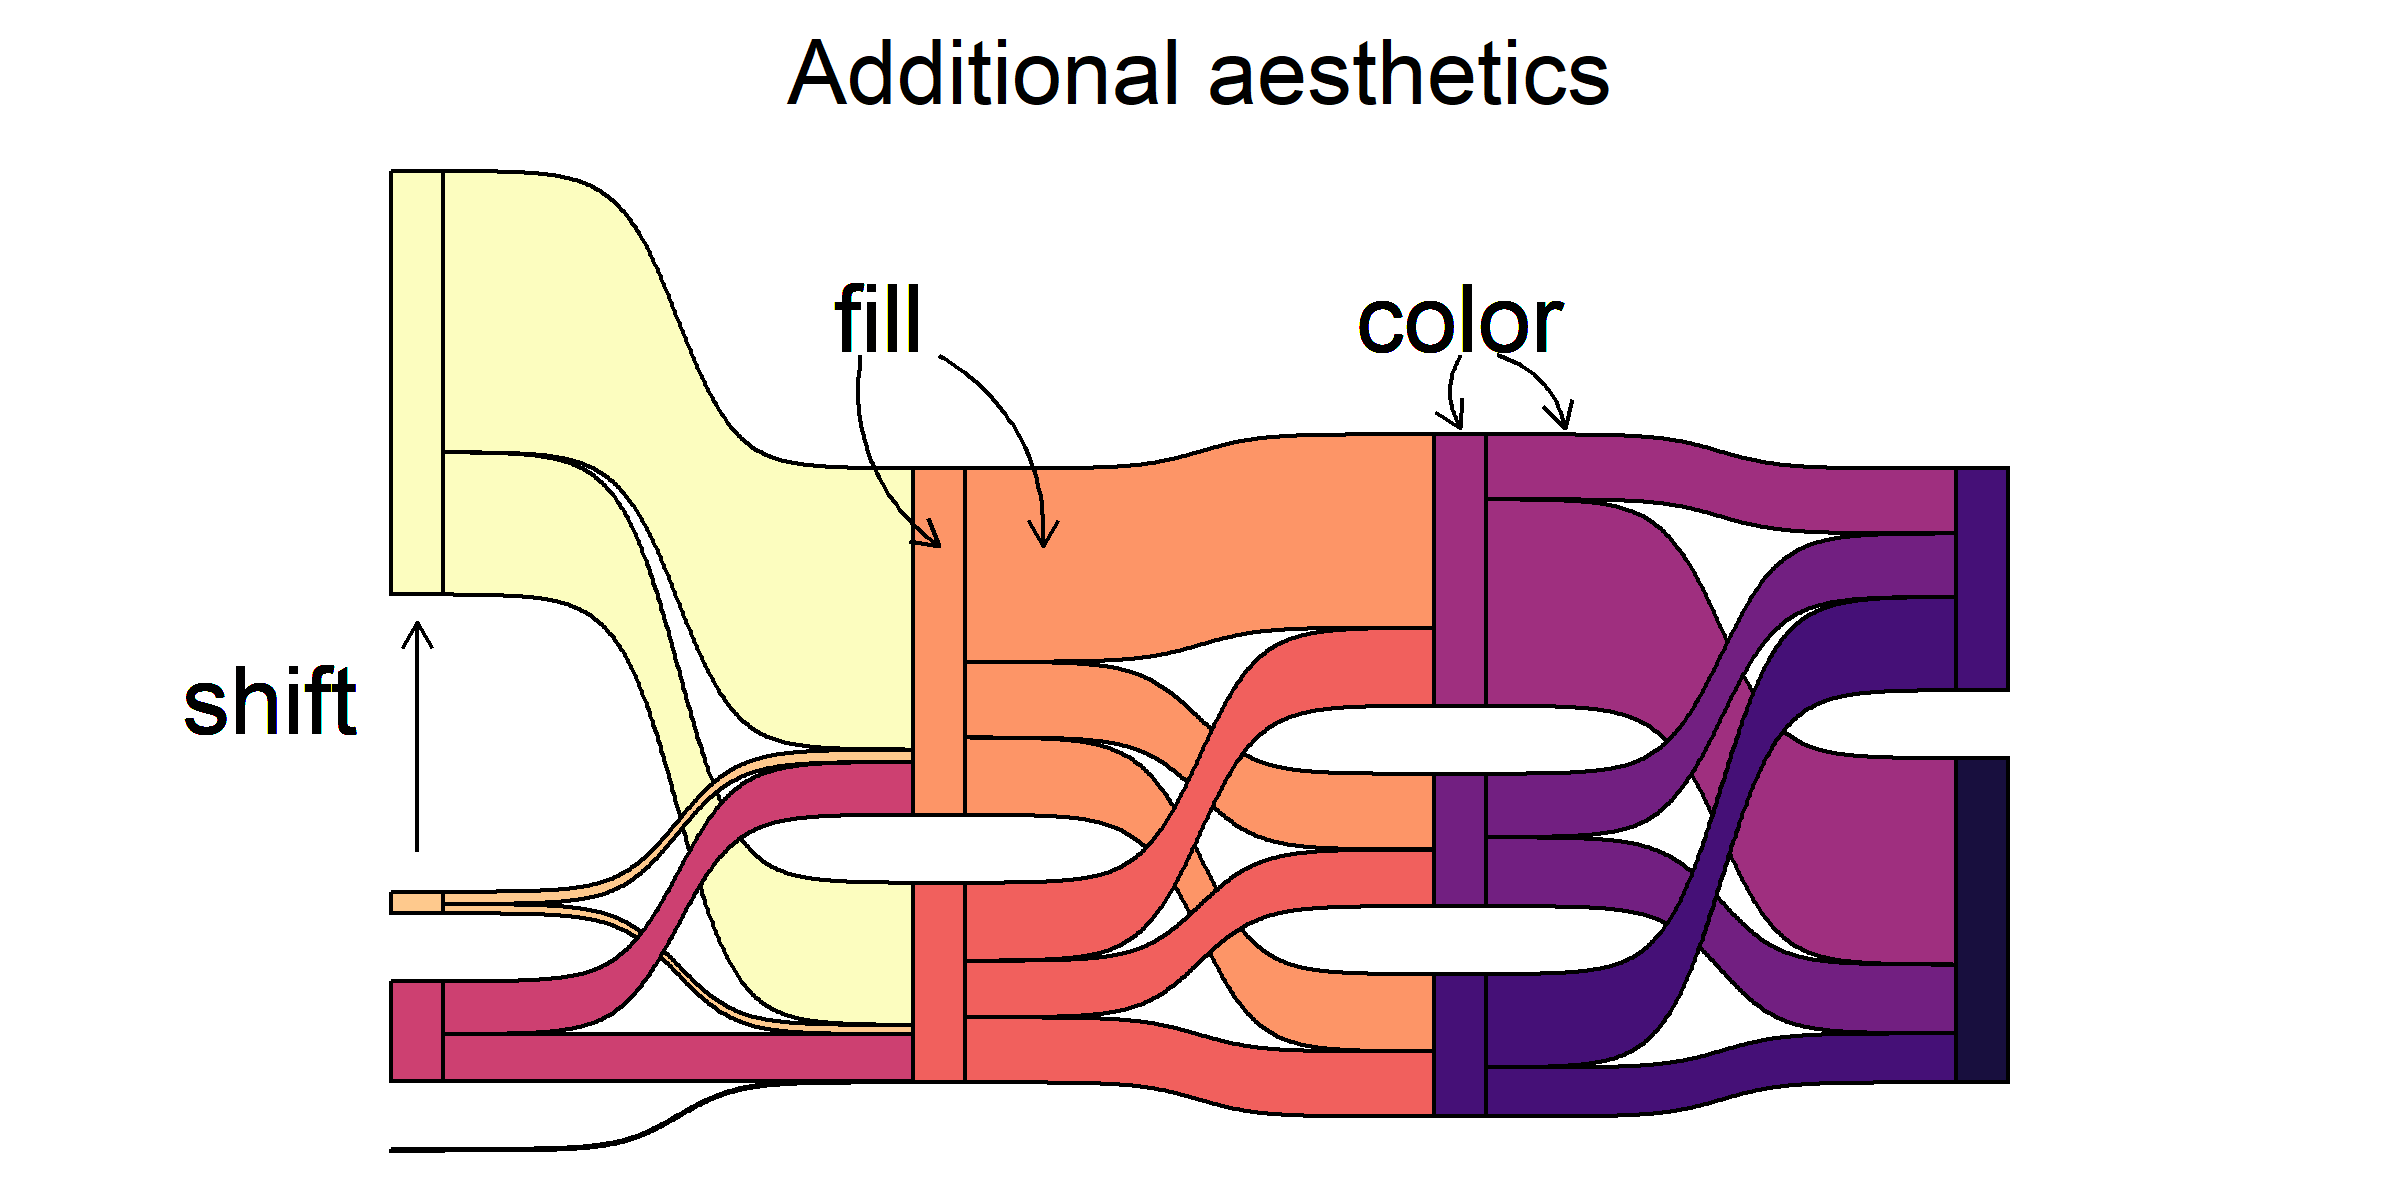
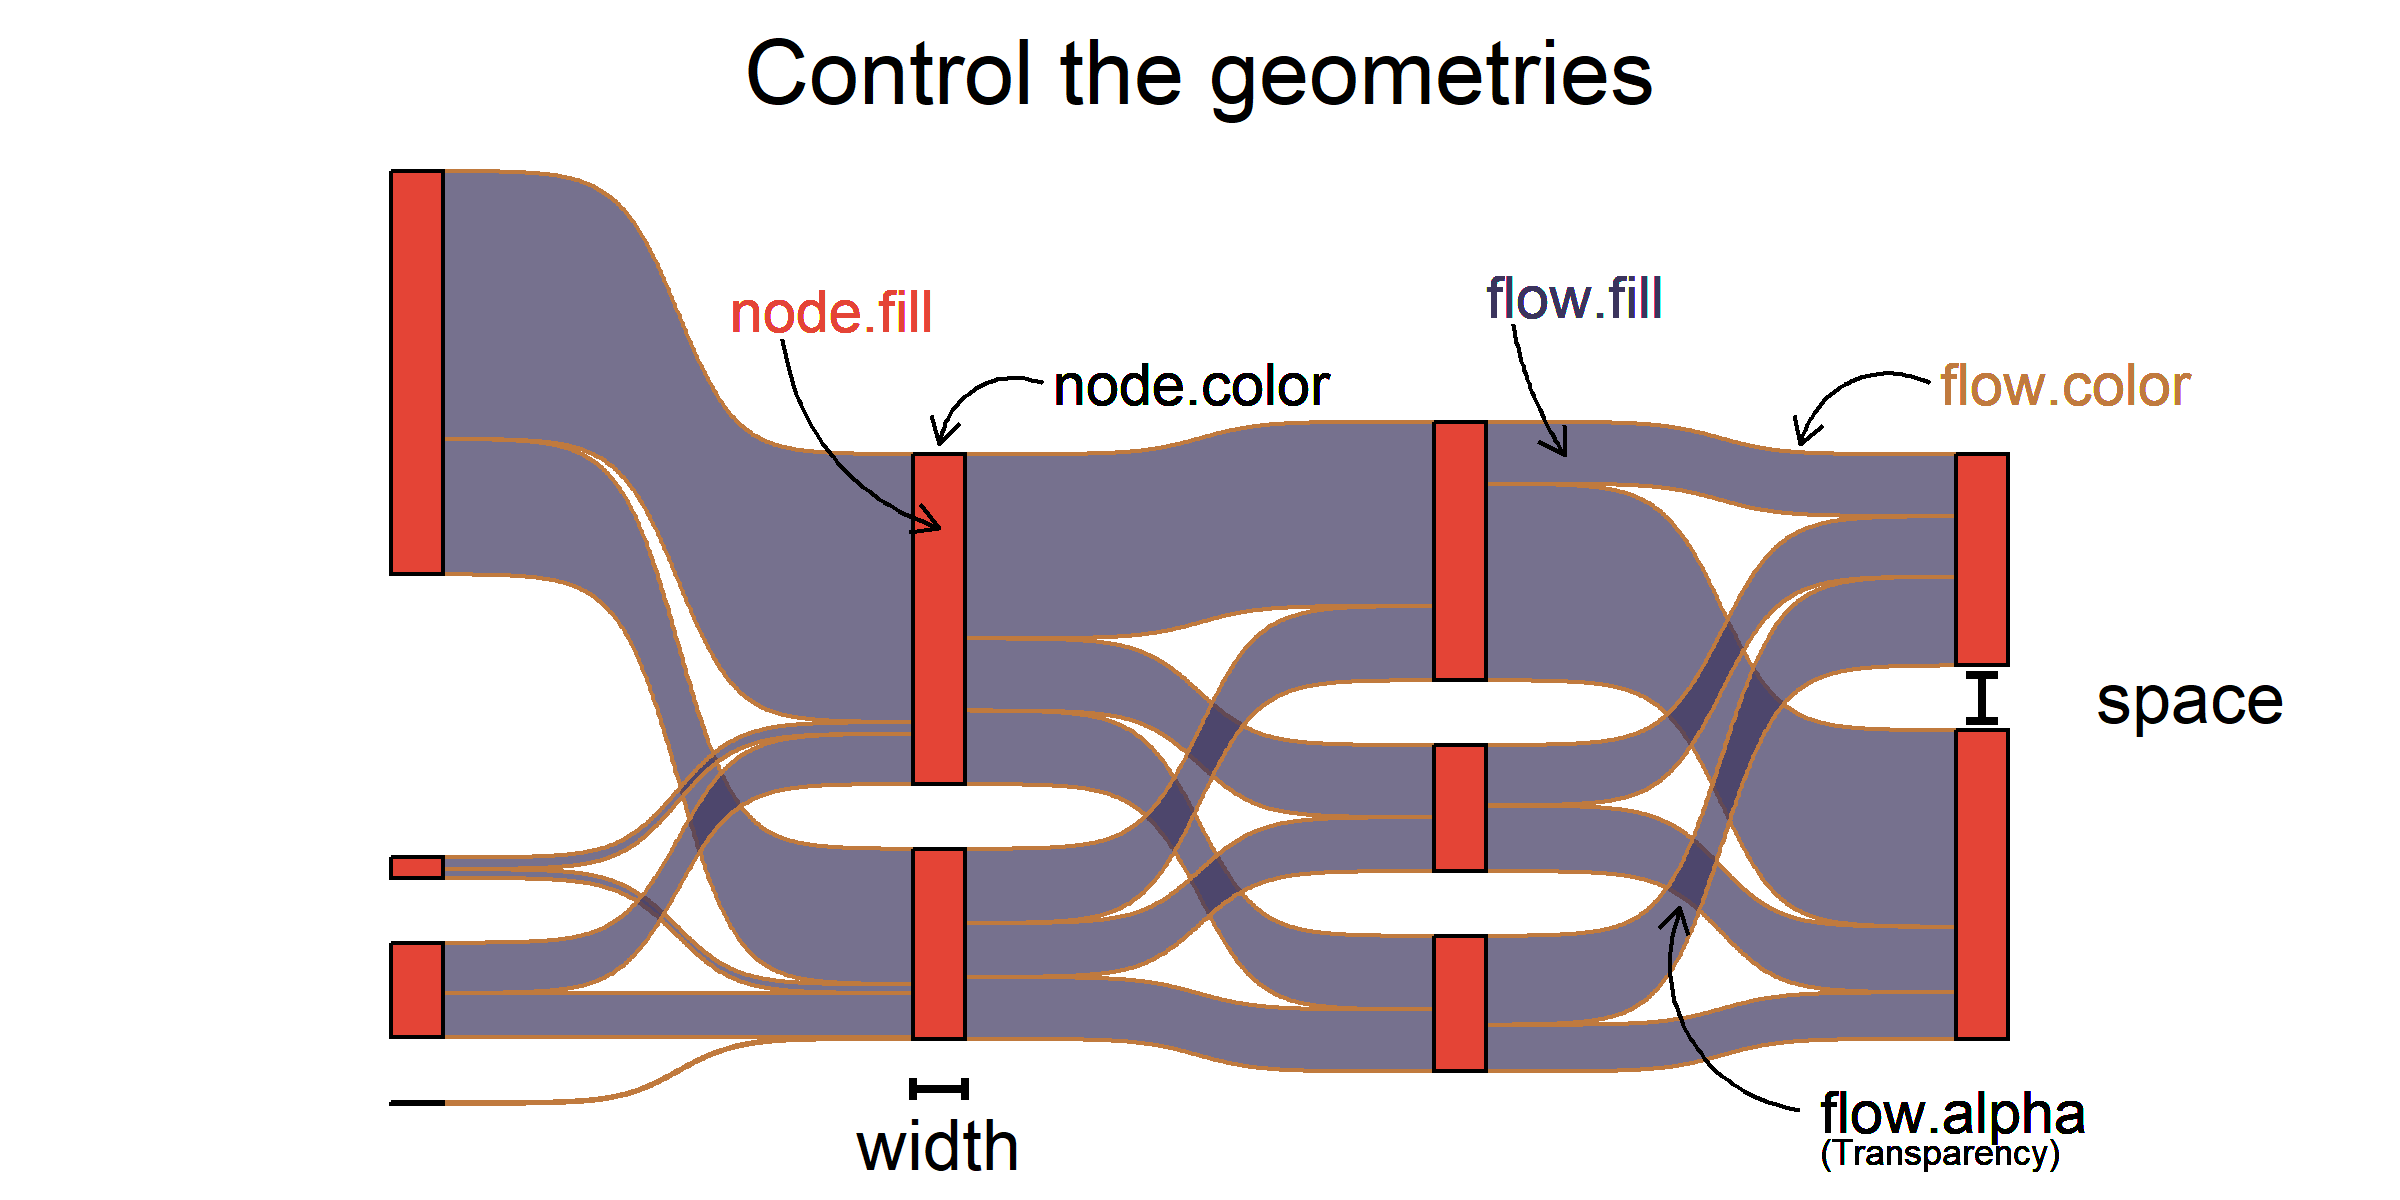
To controll geometries (not changed by data) like fill, color, size,
alpha etc for nodes and flows you can either choose to set a global
value that affect both, or you can specify which one you want to alter.
For example node.color = 'black' will only draw a black line around
the nodes, but not the flows (links).
Basic usage
geom_sankey
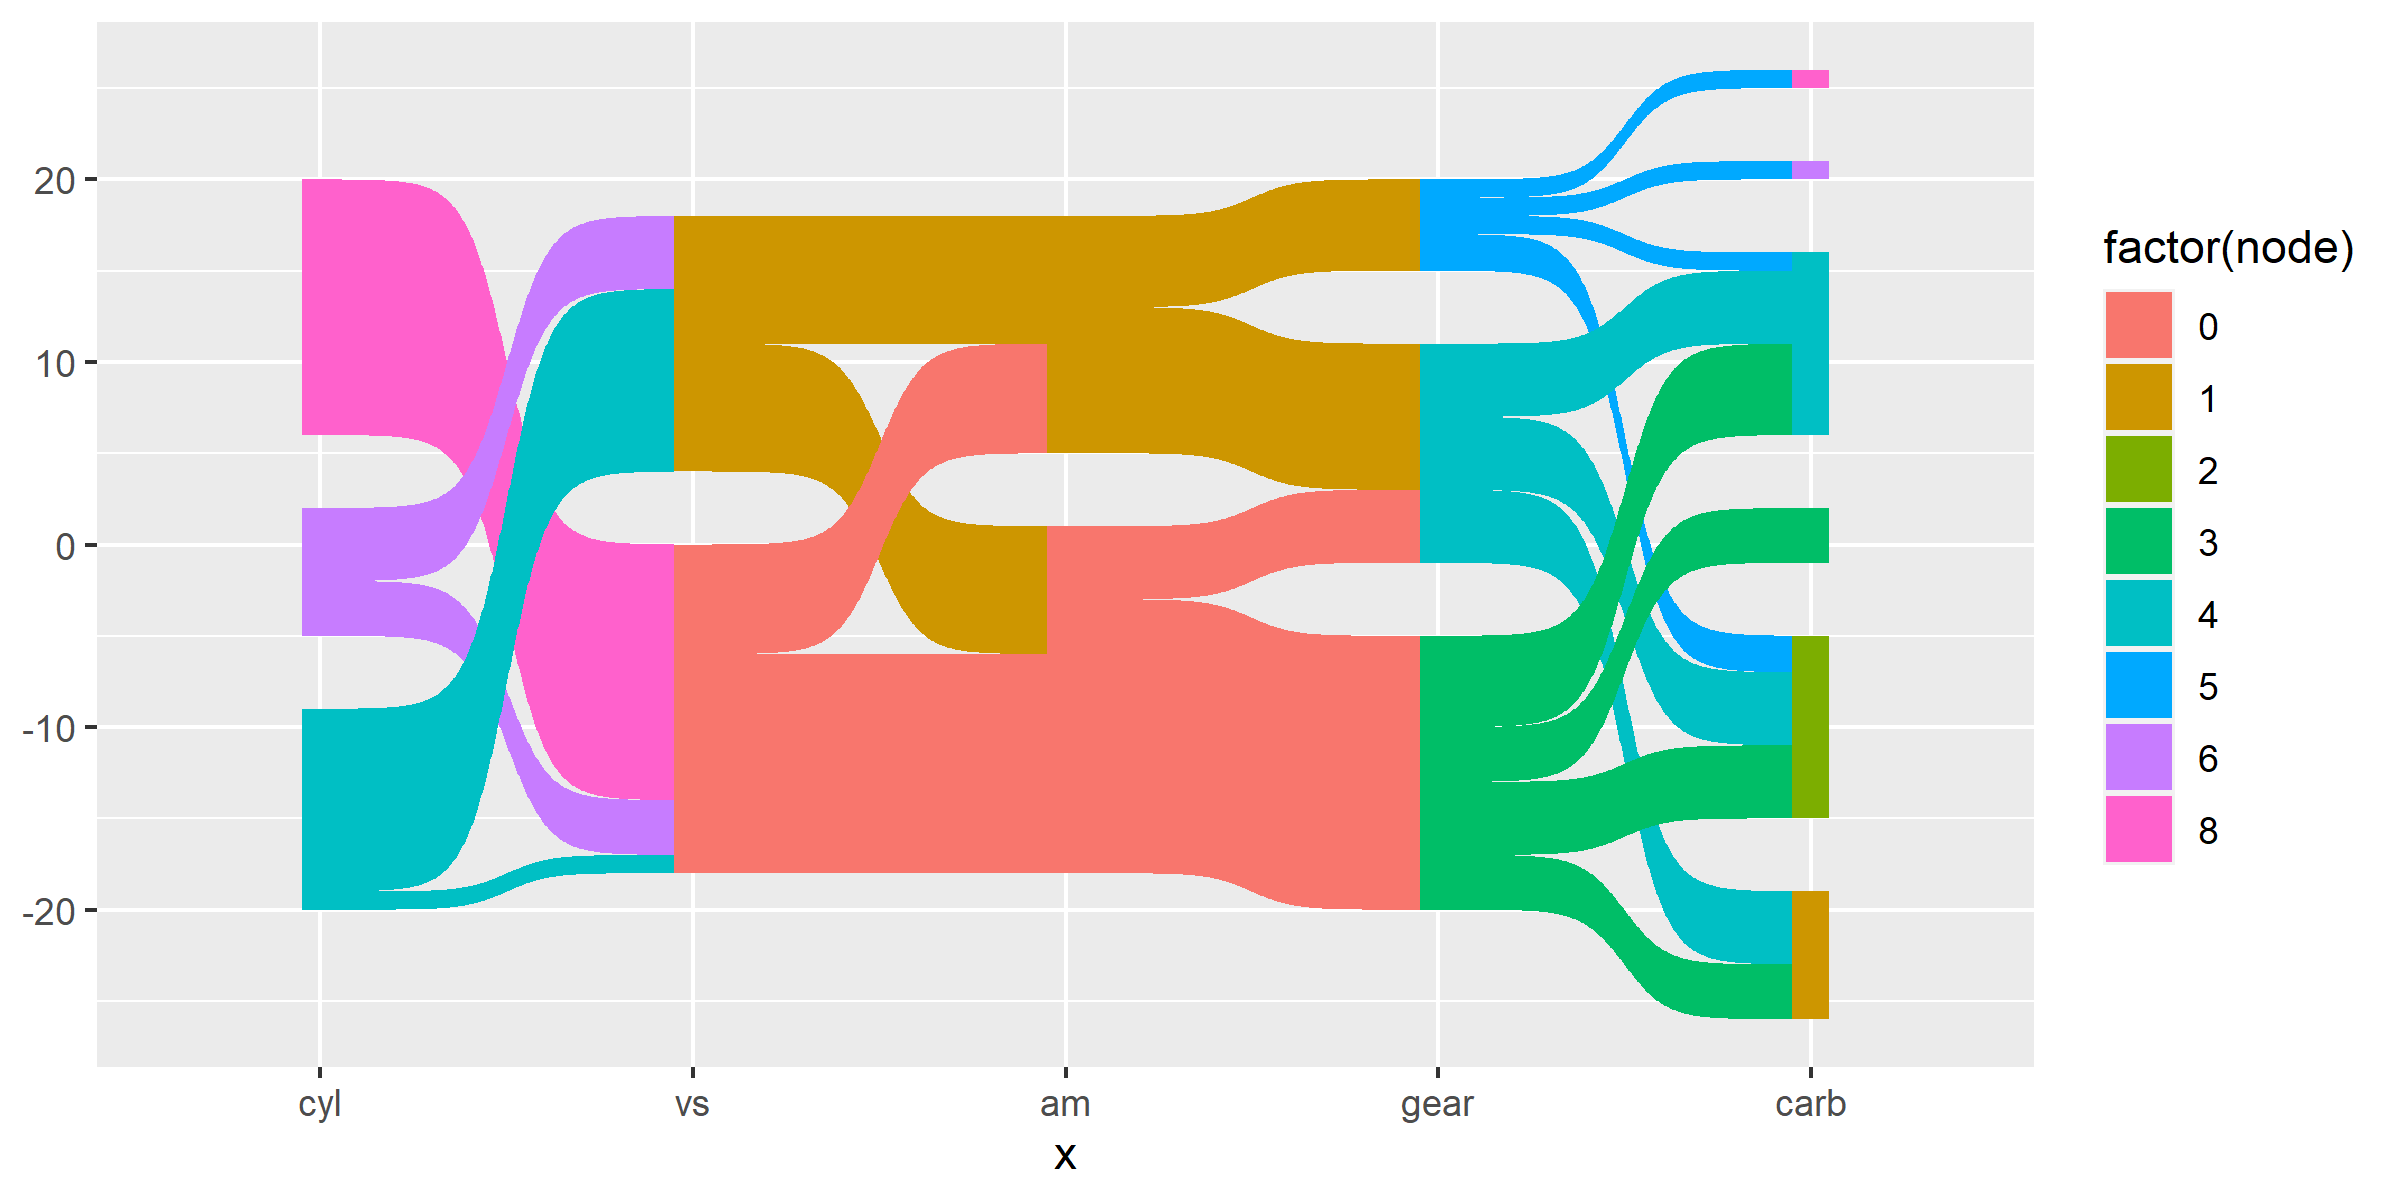
A basic sankey plot that shows how dimensions are linked.
library(ggsankey)
library(dplyr)
library(ggplot2)

df <- mtcars %>%
  make_long(cyl, vs, am, gear, carb)

ggplot(df, aes(x = x,
               next_x = next_x,
               node = node,
               next_node = next_node,
               fill = factor(node))) +
  geom_sankey()
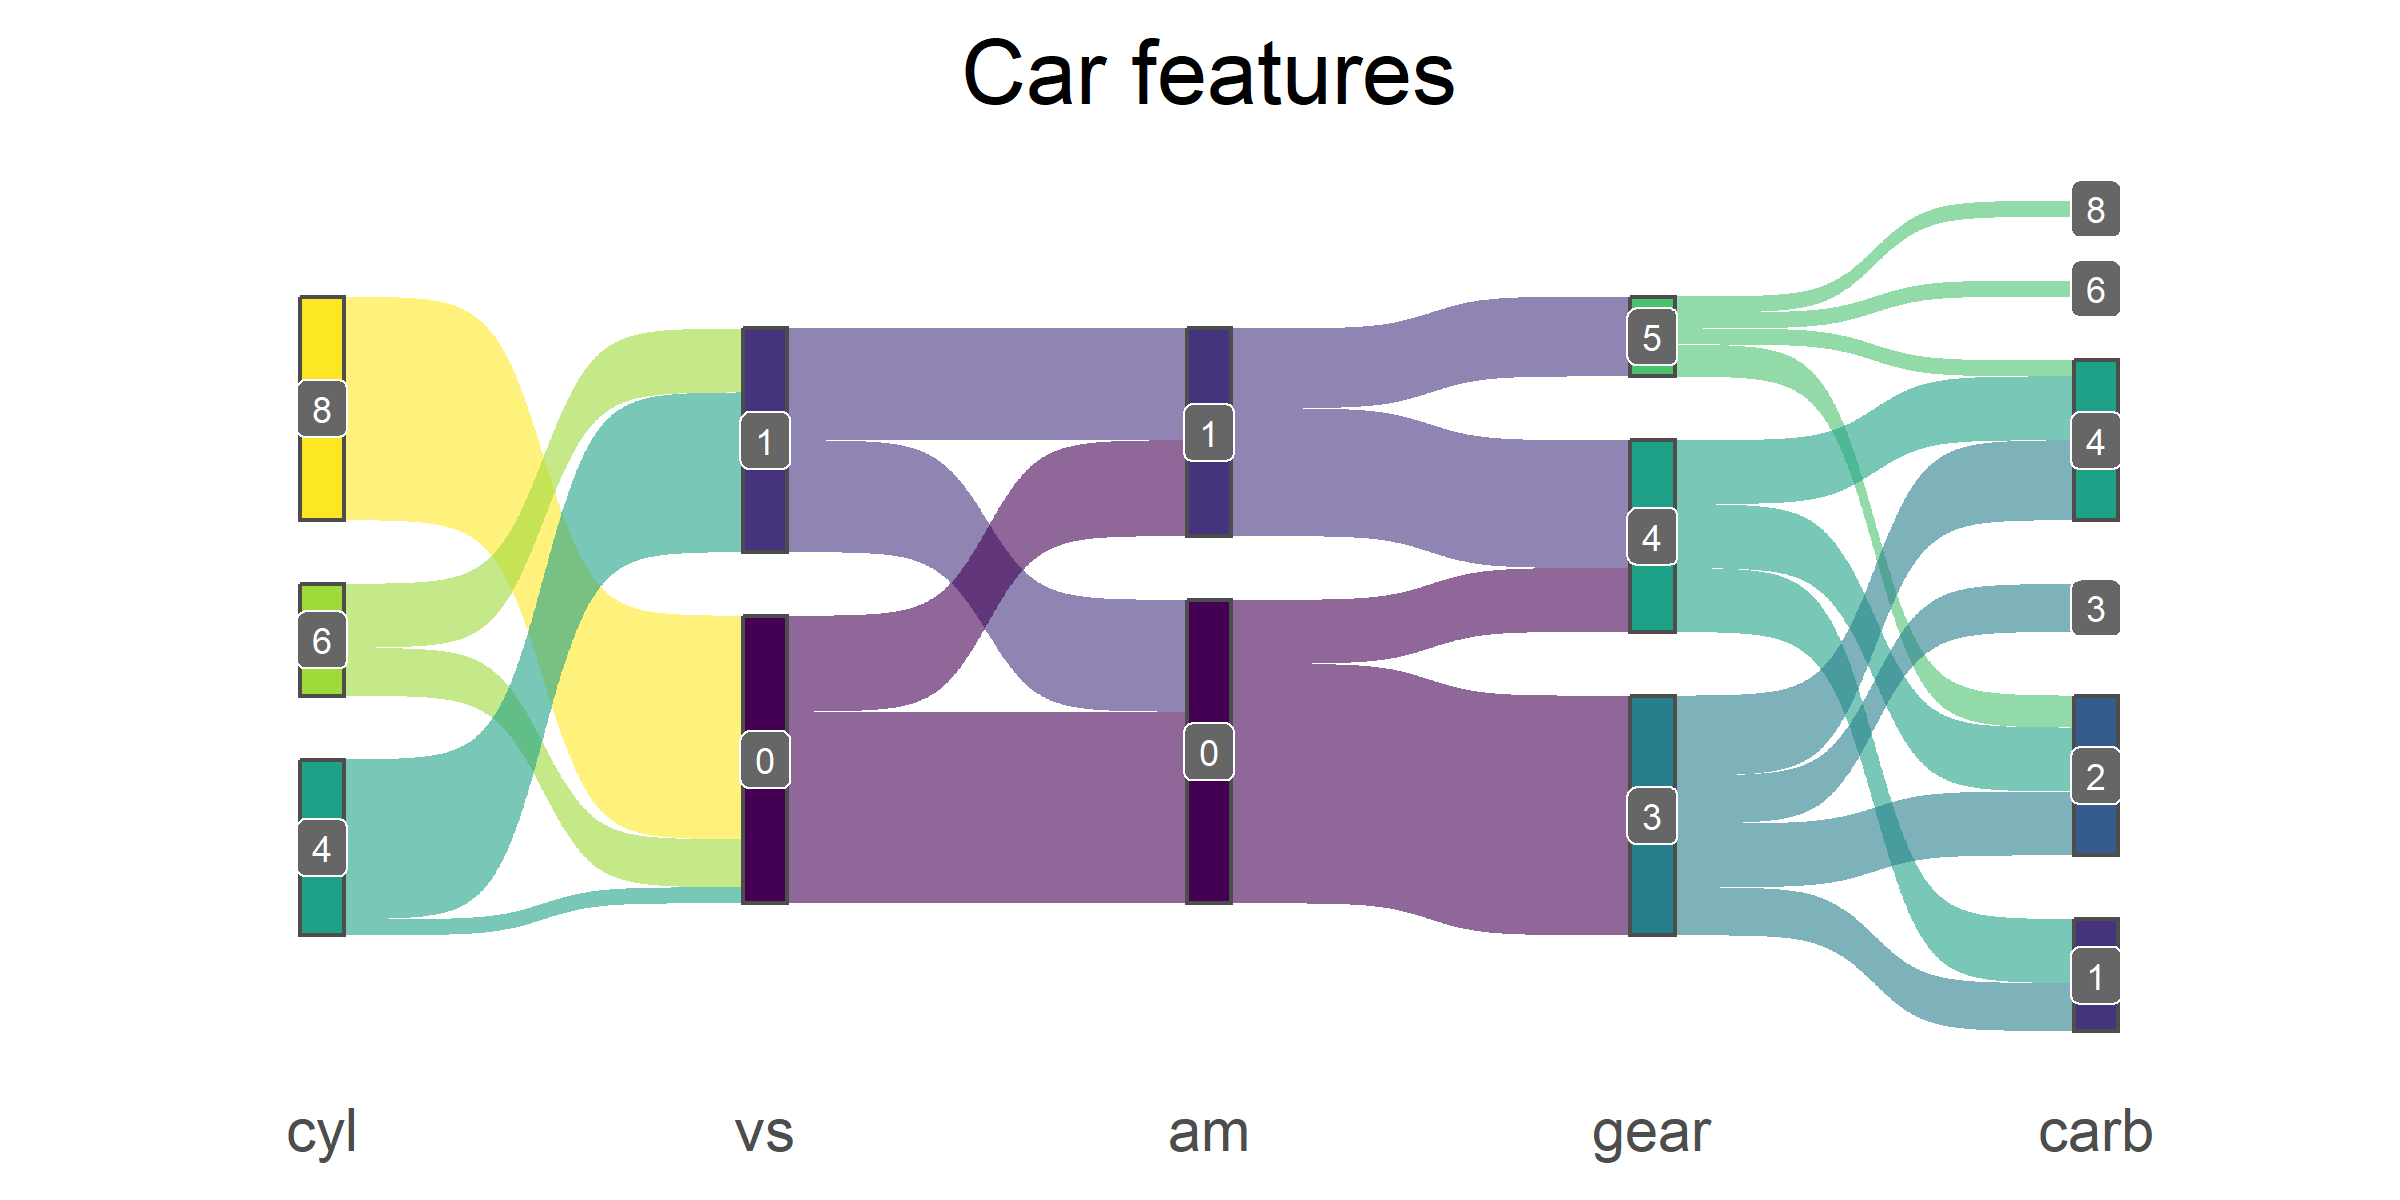
And by adding a little pimp.
-
Labels with
geom_sankey_labelwhich places labels in the center of
nodes if given the same aestethics. -
ggsankeyalso comes with custom minimalistic themes that can be
used. Here I use
theme_sankey.
ggplot(df, aes(x = x, next_x = next_x, node = node, next_node = next_node, fill = factor(node), label = node)) +
  geom_sankey(flow.alpha = .6,
              node.color = "gray30") +
  geom_sankey_label(size = 3, color = "white", fill = "gray40") +
  scale_fill_viridis_d() +
  theme_sankey(base_size = 18) +
  labs(x = NULL) +
  theme(legend.position = "none",
        plot.title = element_text(hjust = .5)) +
  ggtitle("Car features")
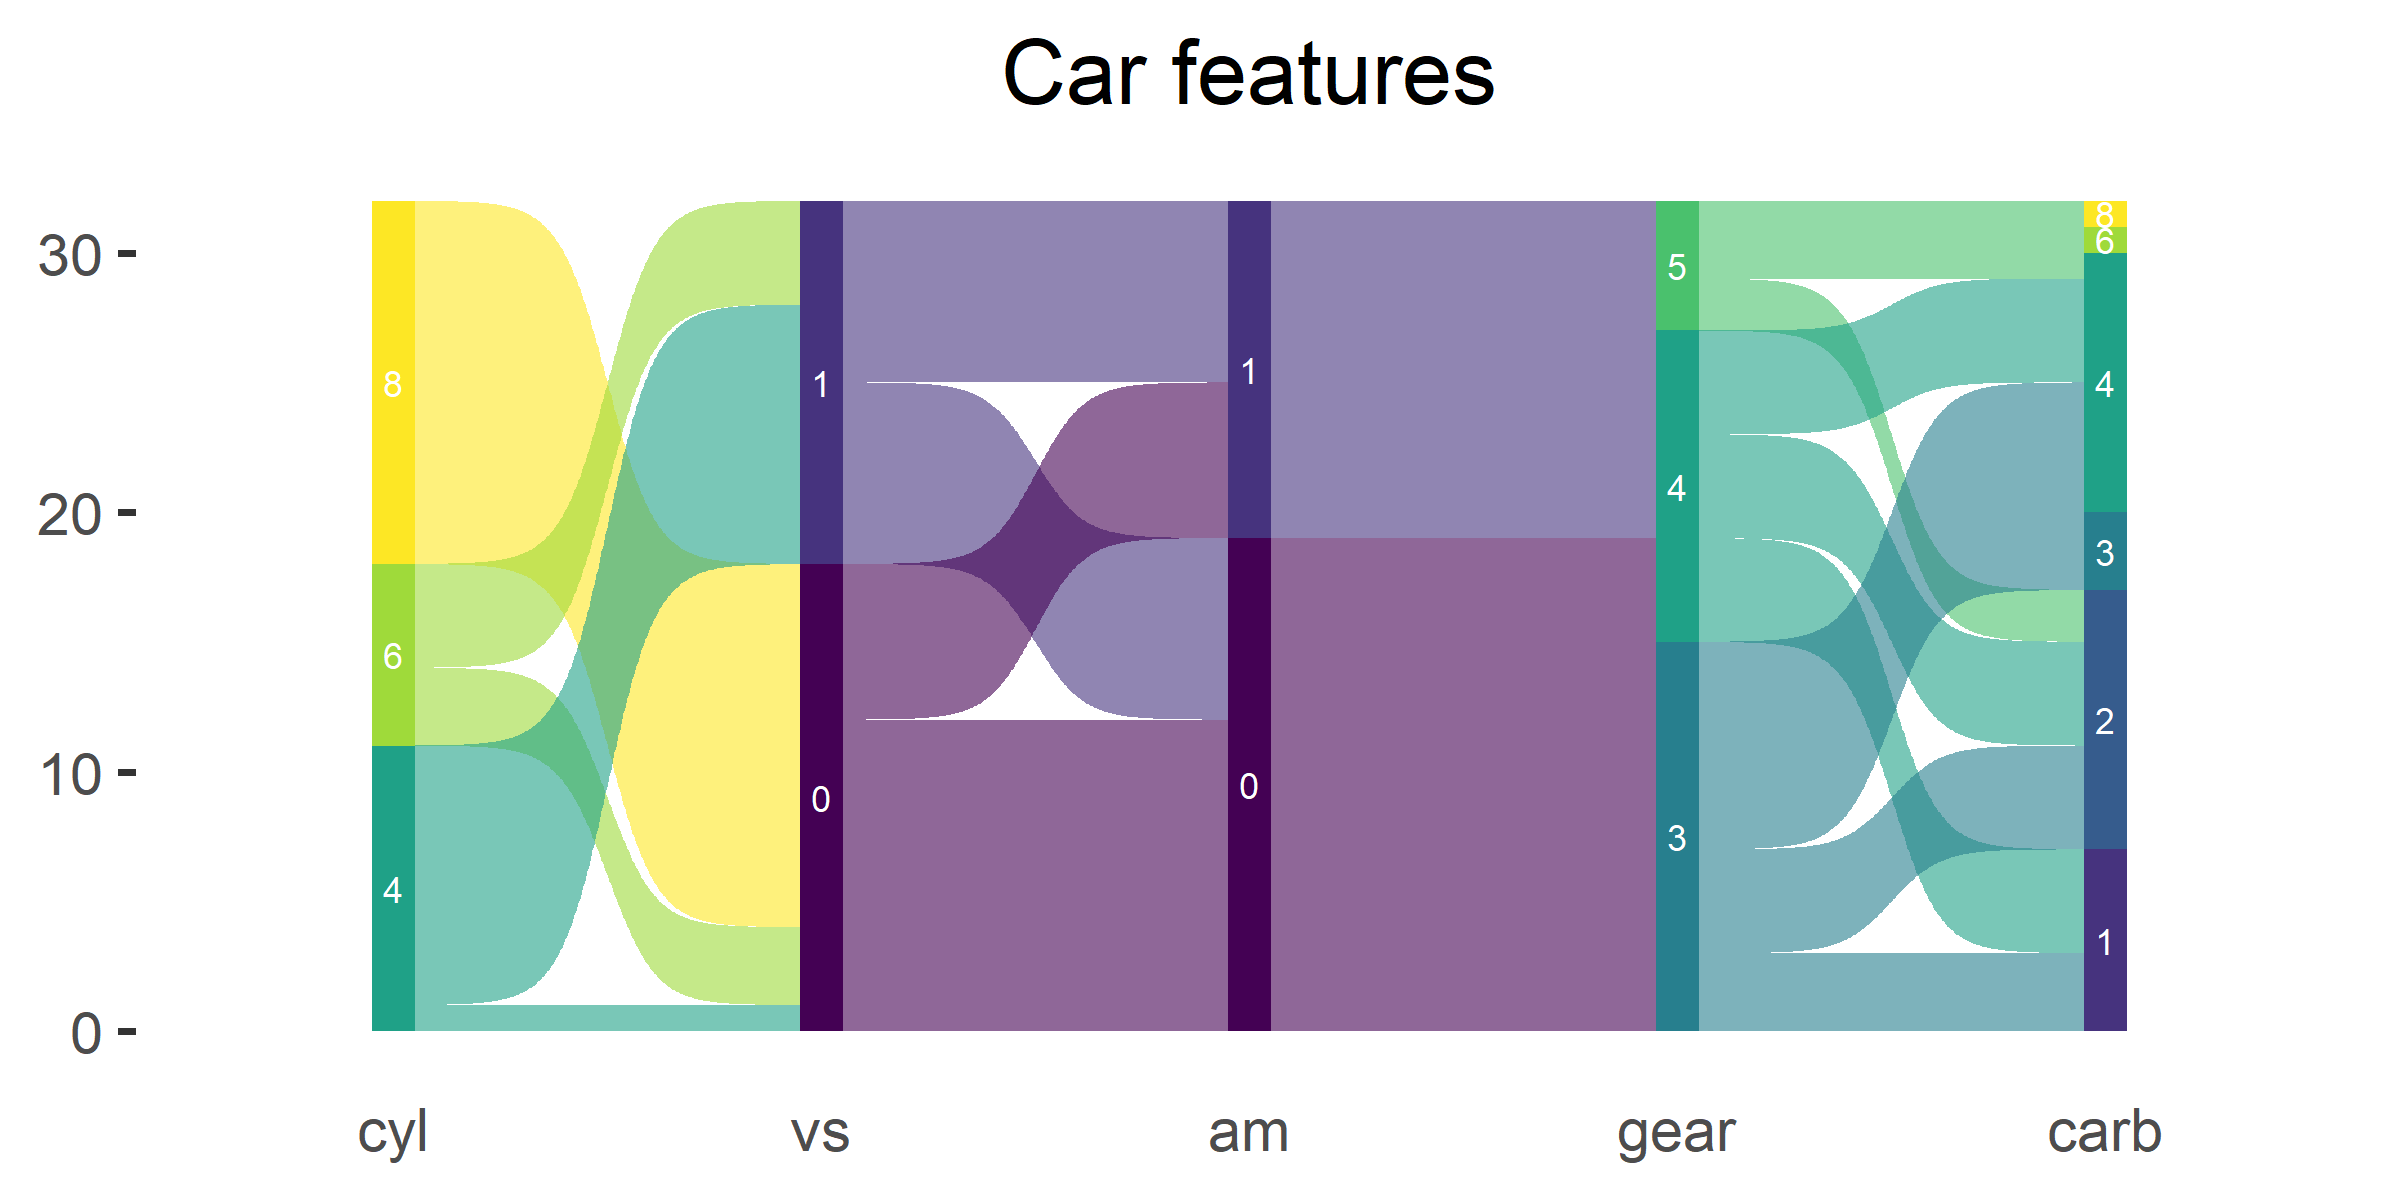
geom_alluvial
Alluvial plots are very similiar to sankey plots but have no spaces
between nodes and start at y = 0 instead being centered around the
x-axis.
ggplot(df, aes(x = x, next_x = next_x, node = node, next_node = next_node, fill = factor(node), label = node)) +
  geom_alluvial(flow.alpha = .6) +
  geom_alluvial_text(size = 3, color = "white") +
  scale_fill_viridis_d() +
  theme_alluvial(base_size = 18) +
  labs(x = NULL) +
  theme(legend.position = "none",
        plot.title = element_text(hjust = .5)) +
  ggtitle("Car features")
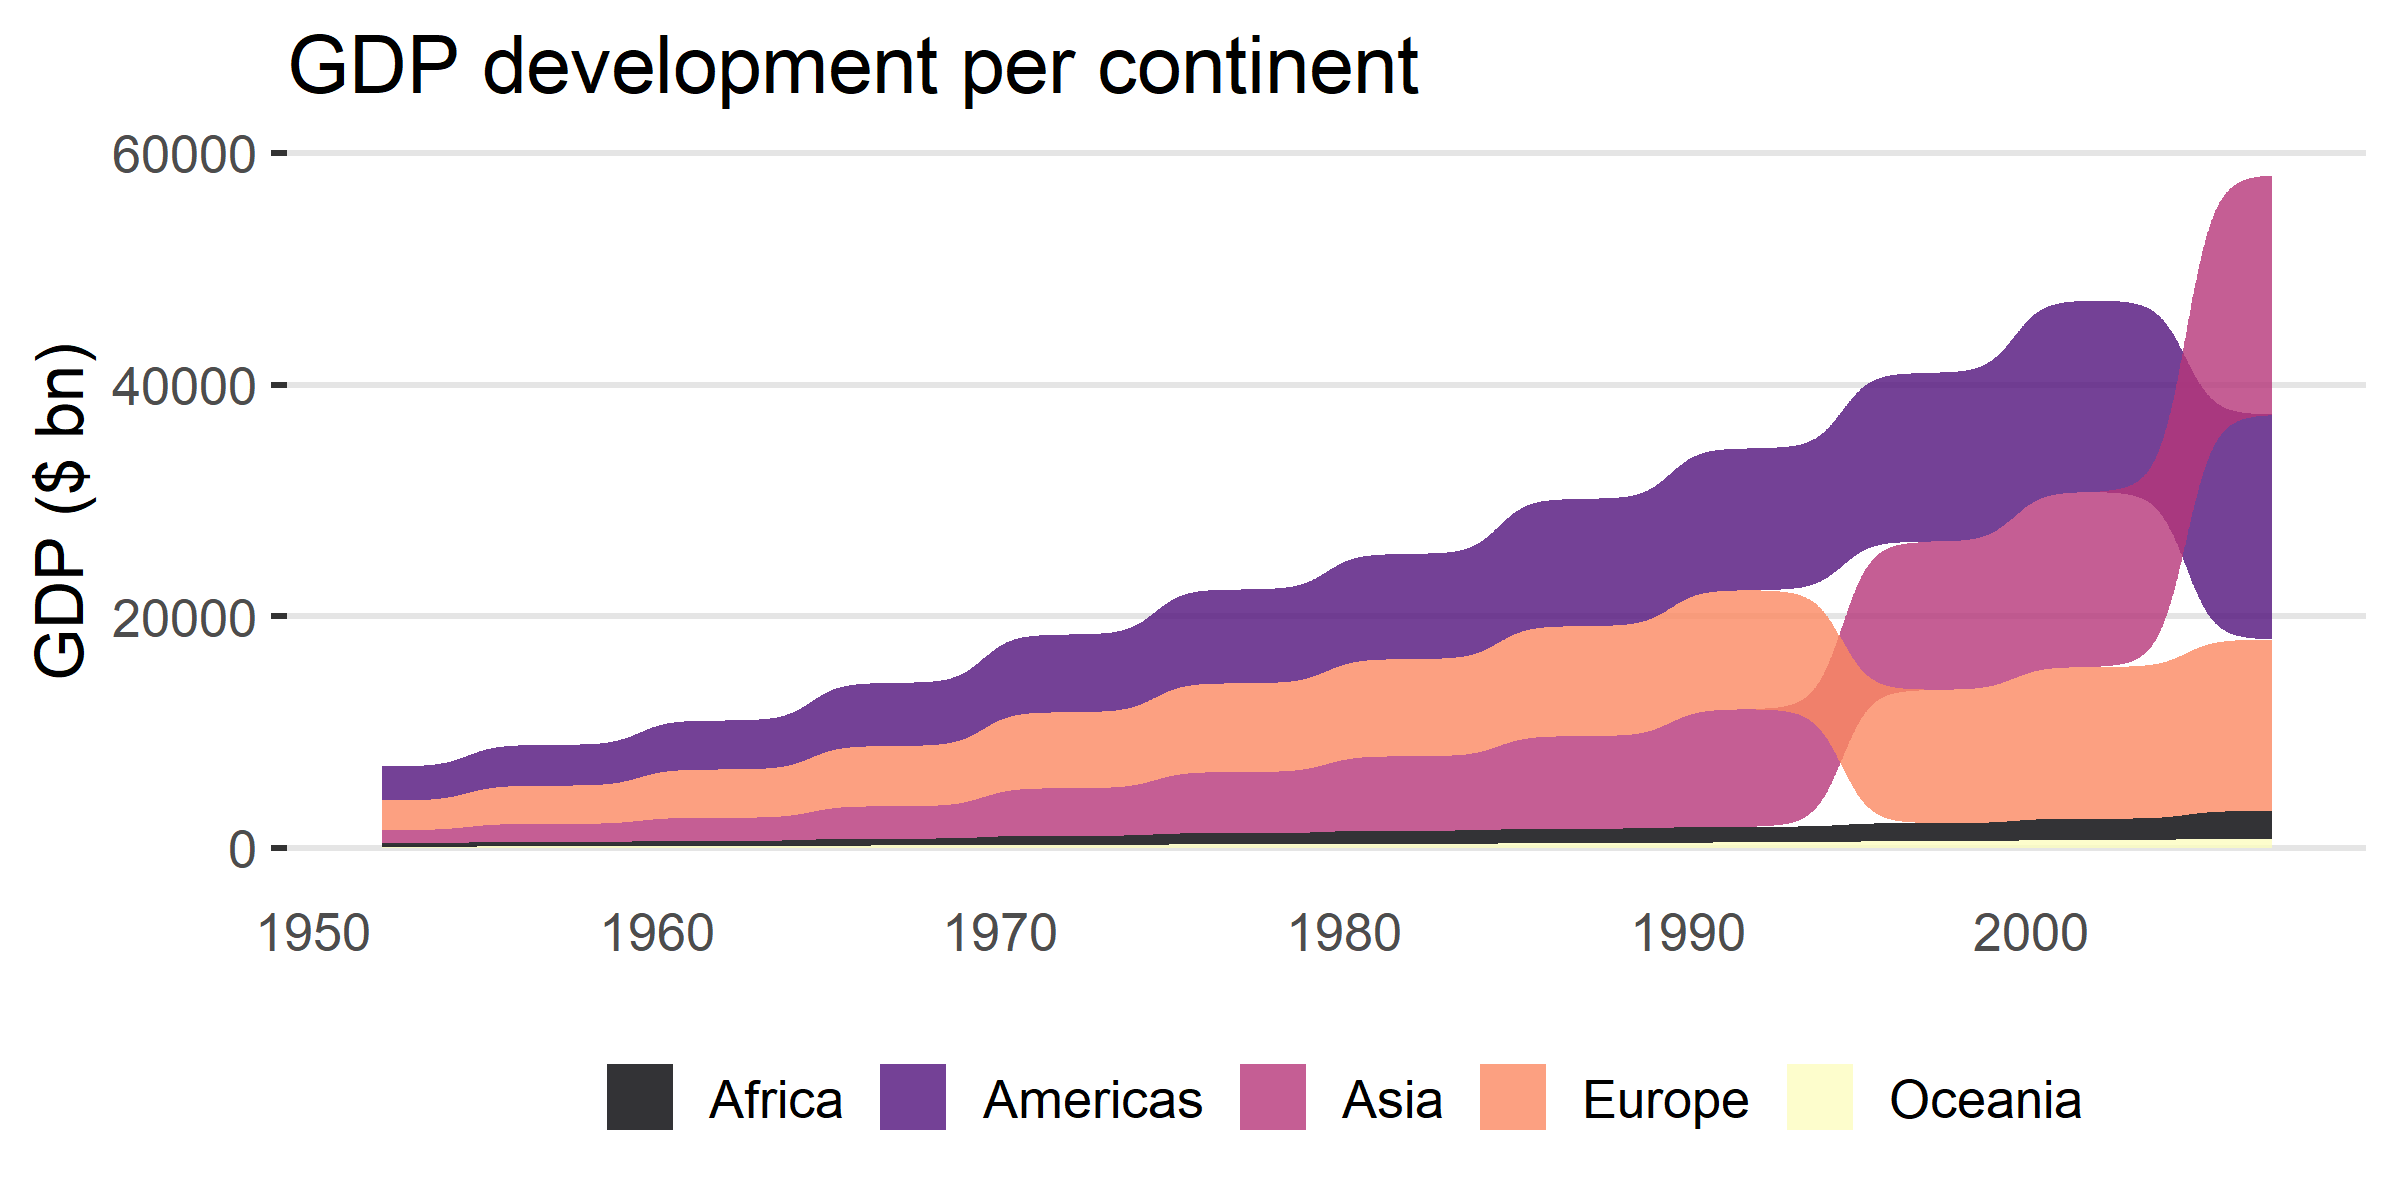
geom_sankey_bump
Sankey bump plots is mix between bump plots and sankey and mostly useful
for time series. When a group becomes larger than another it bumps above
it.
# install.packages("gapminder")
library(gapminder)

df <- gapminder %>%
  group_by(continent, year) %>%
  summarise(gdp = (sum(pop * gdpPercap)/1e9) %>% round(0), .groups = "keep") %>%
  ungroup()

ggplot(df, aes(x = year,
               node = continent,
               fill = continent,
               value = gdp)) +
  geom_sankey_bump(space = 0, type = "alluvial", color = "transparent", smooth = 6) +
  scale_fill_viridis_d(option = "A", alpha = .8) +
  theme_sankey_bump(base_size = 16) +
  labs(x = NULL,
       y = "GDP ($ bn)",
       fill = NULL,
       color = NULL) +
  theme(legend.position = "bottom") +
  labs(title = "GDP development per continent")