chia_plot_manager
Python scripts to manage Chia plots and drive space, providing full reports. Also monitors the number of chia coins you have. Auto Drive helps to automate the addition of new hard drives to your system and to the chia config.
Hopefully if you are reading this you know what Chia is and what a plot is. I am pretty new to Chia myself but I determined that I needed to come up with a way to manage my plots and hard drives that hold thse plots somewhat automatically since my job as a pilot keeps me gone a lot. I am not a programmer, so please, use this code with caution, test it yourself and provide feedback. This is a working version that is currently running and working for my setup which I will explain below. Hopefully it will be of some help to others, it is the least I can do to give back to the Chia community.
Hopefully, this might provide some inspiration for others in regard to their Chia projects. Contributions are always welcome.
Overview & Theory of Operation
In its simplest form, chia_plot_manager bridges the gap between creating a plot, and managing that plot after it has been created.
This project was designed around my desire to "farm" the Chia crypto currency. In my particular configuration I have a singe plotting server (chisplot01) creating Chia plots. Once the plotting server has completed a plot, this plot then needs to be moved to a storage server (chisnas01) where it resides while being "farmed". The process of creating the plot is pretty straight forward, but the process of managing that plot once completed was a little more interesting. My plotting server has the capacity to plot 60 parallel plots at a time and that is where I started to have issues.
One of those issues that I faced was the relative slow speed at which plots could be moved from the plotting server to the storage server. The long and short of it was simple - I could not continue to plot 60 at a time as I could not move them off the plotting server fast enough not to run out of insanely expensive NVMe drive space. Even with 10Gbe connections directly between the two devices, using mv or cp on an NFS mount was pretty slow, others suggested rsync which was also pretty slow due to encryption. The same held true for scp. I even went so far as scrapping the ssh that came with Ubunti 20.04 and compiling and installing High Performance SSH from the Pittsburgh Supercomputing Center. While it was faster it did not come close to maxing out my dedicated 10Gbe link. What I did know is that the problem was not the network. Each machine was connected to a dedicated 10Gbe port on a Cisco Nexus 9000 on a dedicated data VLAN specifically for moving those plots. Iperf was able to saturate the 10Gbe link with zero problems.
Next I wanted to make sure the problem was not related to the media I was copying the data to across the wire. I installed a pair of Intel P3700 PCIe NVMe drives in a strip RAID configuration and did a bunch of tests to and from that mountpoint locally and across the wire. As suspected, locally the drives performed like magic, across the wire, they performed at exactly the same speed as my spinners. Clearly the drive medium was also not the problem. It had to be the network.
I spent a lot of time playing around with all of the network settings, changing kernel parameters, turning on and off jumbo frames and adjusting irqbalancing. In the end some of the changes gave me marginal increases in performance but nothing really helped a lot. It was then that I stated looking at the mechanism I was using to move the files again. In researching I ran across a couple of people with the same situation, network speed on heavily loaded systems and lightly loaded networks where traditional methods of moving files around did not work for them. So they used Netcat instead.
After reading up on the pros and cons of netcat vs rsync (which most recommended) I decided to give it a test. I tested cp, mv, rsync, scp and HPSSH across NFS, SMB (miserable) and SSH. With the exception of SMB they all pretty much worked the same. I was getting better performance than I had been using the stock Ubuntu ssh after replacing it with the High Perfomance SSH and nuking encryption, but still nothing to write home about. Then I tested Netcat. I was blown away. I went from much less than 1Gbe to peaks of 5Gbe with netcat. 100G files that had been taking 18 minutes to transfer were now transferring in 3 to 4 minutes. Even on my heavily CPU loaded plotter, I was seeing transfers around 6 to 7 minutes.
It is also very interesting to note that TrueNAS utilizes netcat for replication when you tell it you want to disable encryption for replication. In researching this further and talking with some on the forums, they noted that they found it always outperformed all other transfer methods. That was enough for me to validate my decision!
As far as plots go, most folks recommend not using some type of RAID array to protect your plots from loss. the thought process is that if you lose a single plotting drive, no big deal, toss it in the trash and put a replacement drive in and fill it back up with plots. Since I really like FreeNAS, I had just planned on dropping in a new FreeNAS server, throwing a bunch of nine drive RAIDZ2 vdevs in place and move forward. But as many pointed out, that was a LOT of wasted space for data pretty easily replaced. And space is the name of the game with Chia. So with that thought in mind, I decided to build out a jbod as suggested by many others. The question was how to manage getting the plots onto the drives and what to do when the drives filled up.
Welcome to my project! I ended up with basically a client/client/client/server arrangement. The software on the plotting server would watch for completed plots and then send those plots (using netcat) to the NAS server. The software on the NAS server would automatically monitor all available drives in the system and place the plot where it needed to go, pretty much all on its own. As I said earlier, my job as a pilot keeps me in the air a lot and I really needed a hands off approach to make this work.
Beginning with V0.9, the software now supports multiple Harvesters/NASs across the board, both from a reporting standpoint and also from the plotter standpoint. When configured in a multi-harvester mode, the plotter will query each Harvester to find out which one has the most space and send the plot to that Harvester. I have added in network checks and if a Harvester that you have configured fails the check, yu will get an immediate notification. If you are running the farm report, it will notify you on the report.
Beginning in V0.94, we now fully support portable plot management as well as old style plot replacement with portable pool plots. By replacing your old plots one-at-a-time, you maximize the number of plots you are farming at all times. Also has a feature to fill all of your empty drive space first with your new pool plots before starting to replace your old plots. Includes a low water mark to help manage the process.
On the Plotter side (via cron):
- Monitors my -d directory for completed plots
- Determines if the plot is complete based on the size and name of the plot (currently k32 only)
- Checks to see if we are already sending a plot to a Harvester/NAS, if so, stops
- When it is clear to send, picks which plot to send and netcats it to the Harvester/NAS
- If you have configured multi-Harvester mode, pics the best Harvester based on available plot space
- If you have configured for pooling, appends "portable." to the name of the plot before sending it.
- If you have configured replace_non_pool_plots on your harvester, it will ask your harvester to delete a plot to make space.
- Utilizing an ssh subprocess, starts a receiving netcat on the selected Harvester/NAS
- After the transfer is complete, checks the exact file size of the plot on both systems as a basic verification
- Once files sizes are verified, deletes the sent plot
- Kills any lingering netcat connections on the selected Harvester/NAS
- Supports any number of harvesters and prioritizes sending plots to the harvester with the most space available.
- If replacing old plots with new pool plots, above utilizes number of plot spaces available based on free space + number of old plots.
On the Selected Harvester/NAS side (via cron):
- Checks for all available plot storage drives on the system in real time (in case new ones were added)
- Based on number of plots on drives, selects the next available plot drive to receive plots
- Updates the receive script with the currently selected plot drive
- Once that drive is full, selects the next available plot drive and updates the receive script
- Complete, selectable notifications via EMail, SMS and Pushbullet about the drive change, includes some SMART drive information
- Sends a daily email report including # of drives, # of plots currently and # of plots total based on current drive storage
- Daily email also includes plot speed, total plots in last 24 hours and TiB plotting in last 24 hours
- Since notifications are already built in, will extend it to alert on drive temps and smartctl warnings
- For local plotting on Harverster/NAS (Which I do), includes a ```move_local_plots.py``` script to manage local plot movement (via cron)
- If you have configured replace_non_pool_plots, completely manages replacing old plots with new plots one-by-one.
- Includes a global UUID lookup against all harvesters. Return Harvester name and mountpoint if UUID is found.
- Eventually integrate information into Influx with a Grafana dashboard (including power monitoring via UPS)
On the Farmer (via cron):
- Checks the chia logs (~chia/.chia/mainnet/log/debug.log) for activity
- Looks for new coins
- Once found updates a local file showing how many Chia you have
- Emails, texts, etc when you get a new coin with the current amount you have
- Does NOT use the block explorer so verify!
Command Line Options on the NAS
- Ability to run quick reports to the screen (basically daily email dumped to the screen)
- Ability to send a Drive update email
- Ability to monitor drive temperatures by device and serial number
- Ability to run a `Farm Wide` report incorporating all Harvesters
Dependencies
This was designed and is running on Ubuntu 20.04 for both the Plotter and the Harvester/NAS so pretty much any linux flavor should work. Listed below are the things that I am using on both systems. The one thing to watch out for on the NAS is the version of pySMART you are using. I ran into a bug with the version (1.0) on PyPi and ended up using the version from the TrueNAS Folks. DO NOT use the version from PyPi, it won't work until patched. If you are using my install.sh script, the correct version will be installed.
I am running on Python 3.8.5 and pretty much everything else came installed with the default Ubuntu Server 20.04 installation. Be sure to install smartmontools apt install smartmontools as well as the following:
- Sentry-SDK - (Optional, I use it for error tracking)
- Pushbullet (0.12.0) - (Optional, used for PB notifications)
- Twilio (6.54.0) - (Optional, used for SMS notifications)
- JinJa2 (2.11.3) - (Optional, Used for Email notifications)
- ConfigParser (5.0.2) - Used for reading and updating config files
- py-SMART (0.3) - Used for reading drive information
- Natsort (7.1.1) - Used for natural sorting of drive numbers
- Sysstat - Used to monitor Disk I/O Stats
- Paramiko (2.7.2) - Used to grab remote harvester stats
Installation & Configuration
Here is a very in-depth installation document that I have started: https://docs.google.com/document/d/1T2A8NboiPVpcI9shXrXlRleXiQSZ0s0I7P-F9ssOMhM/edit?usp=sharing
UPDATE: The above google doc is WAY out of date, install is much easier now with only a single configuration file to edit. I will make an update to this soon!
The installation of the actual scripts are pretty easy. Just clone the repo and drop it on your server. A lot of what happens is very specific to how I have my systems set up so I will explain my layout in detail along with where in the code you may need to look to make changes to fit your needs. For IN-DEPTH instructions pretty much step-by-step, take a look at the google doc I linked to above. Again, please read the document above for very in-depth instructions.
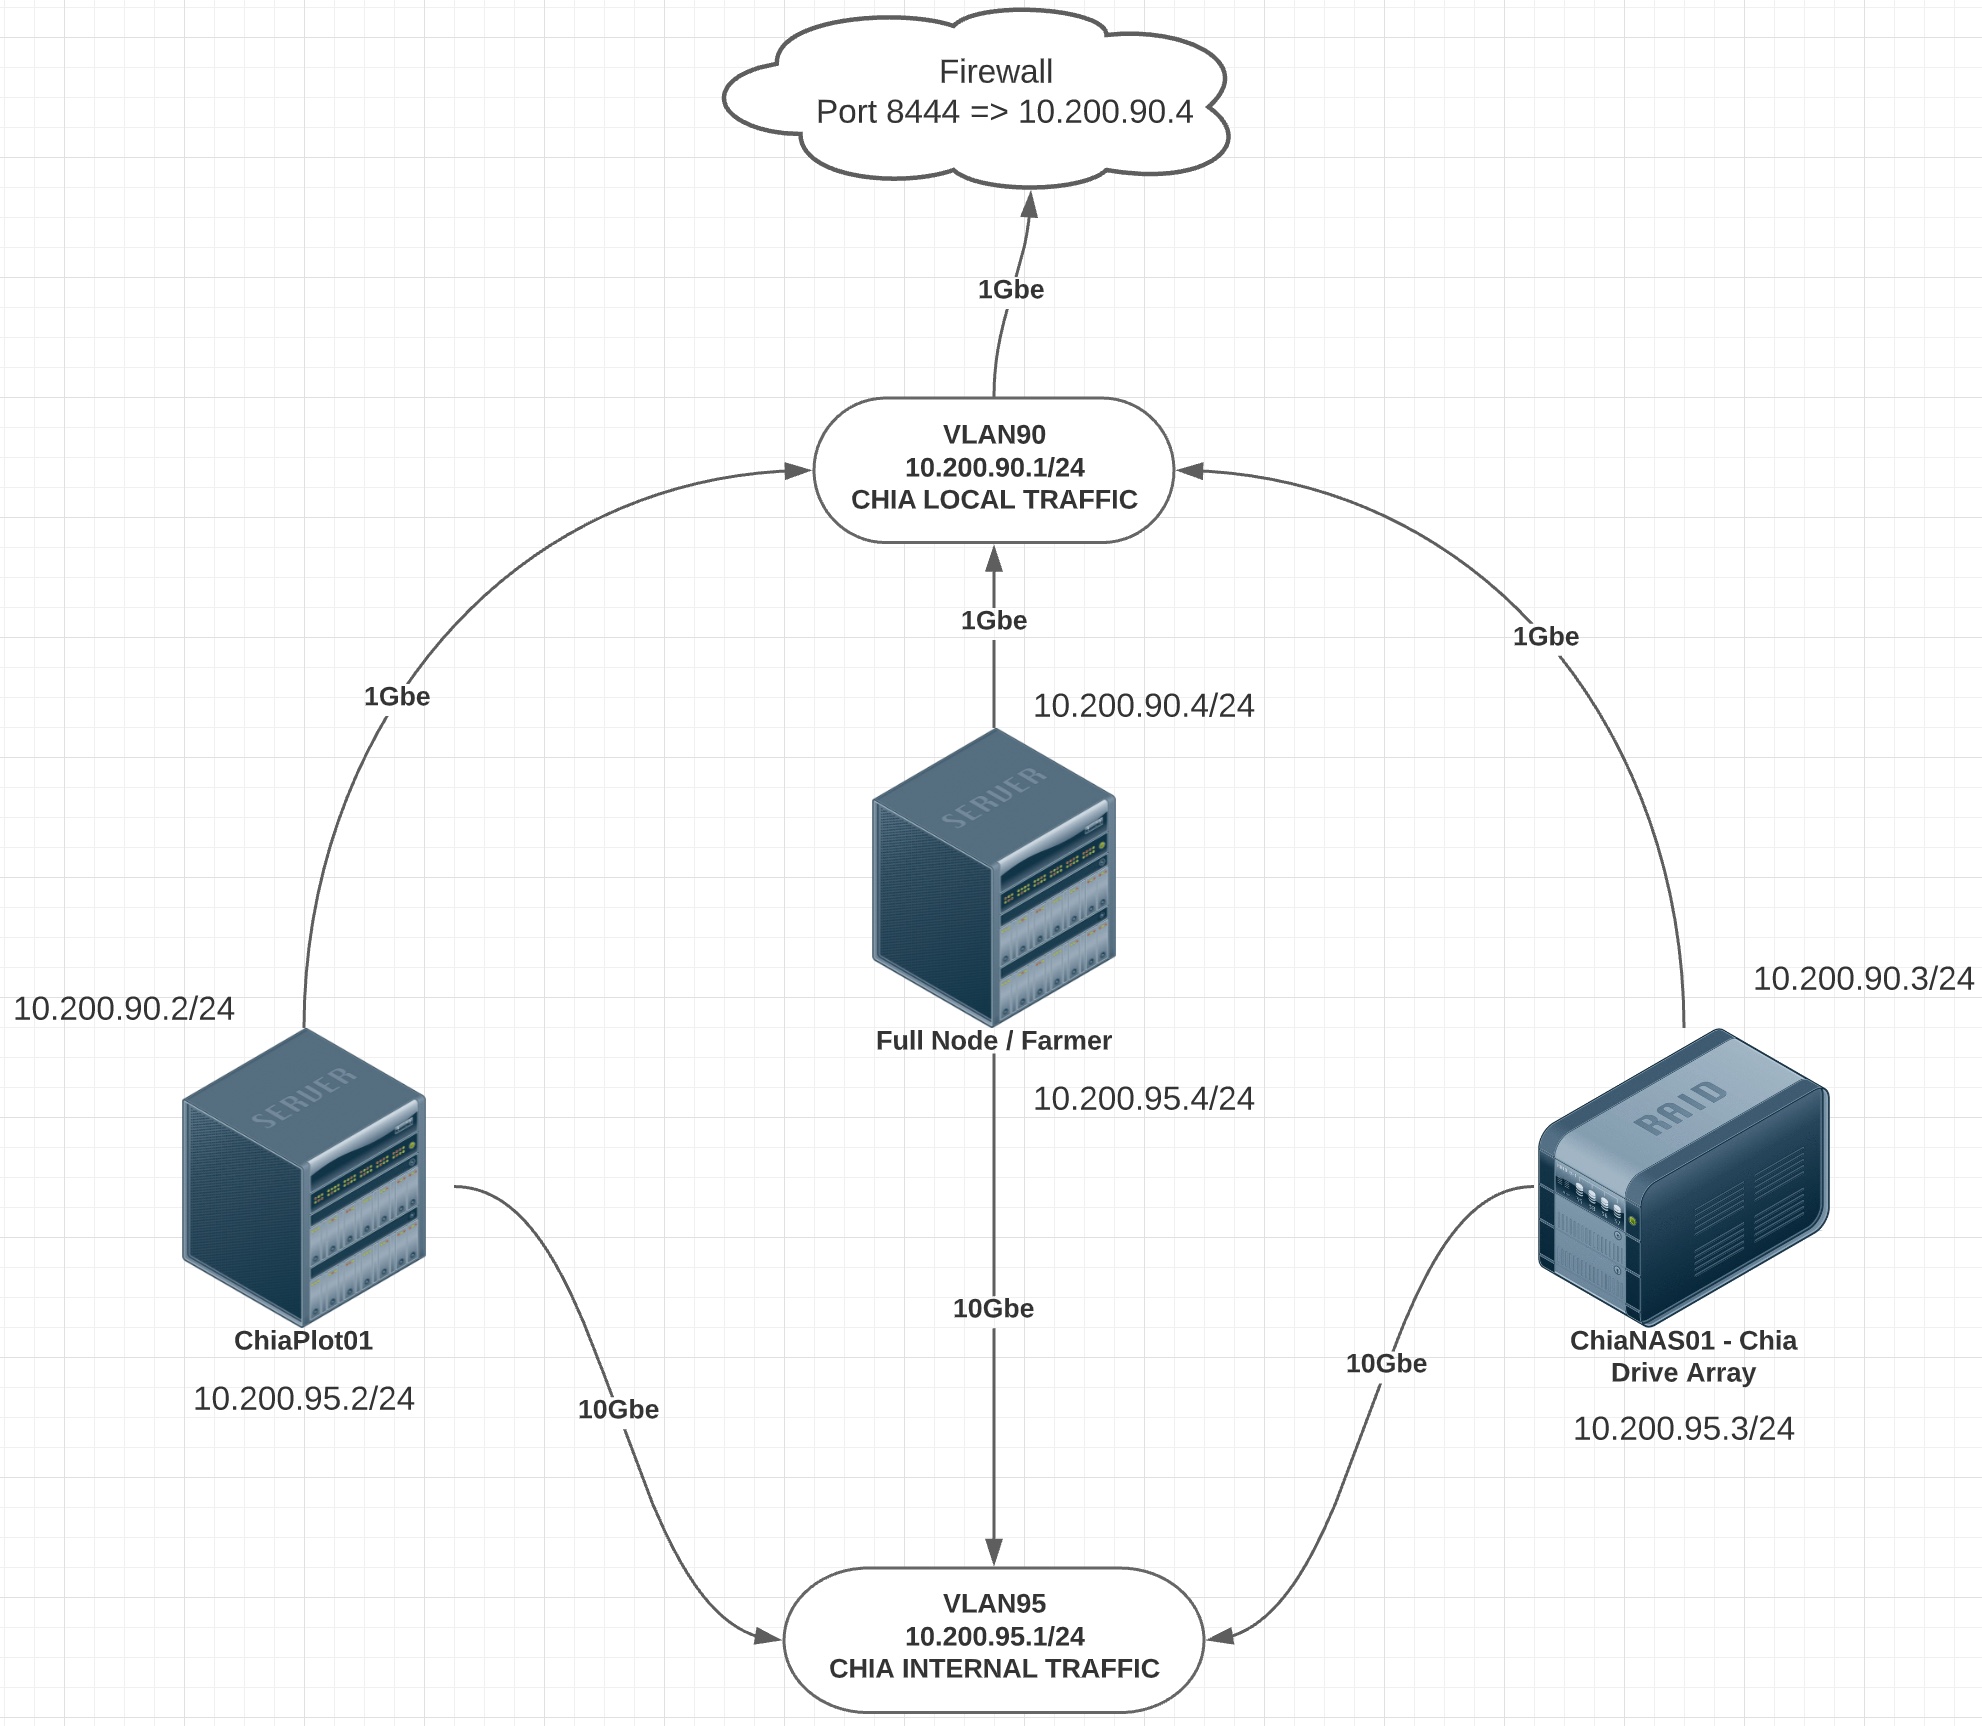
Network Configuration
Before we get too deep into the installation and configuration of the scripts, I want to explain how I have my servers and network setup. Everything you read or see here will be based on this network diagram. If you have multiple Harvesters, they would connect the same way the first one does. Something to note, you absolutely should separate your Harvester/NAS traffic from your plotter and that of your farmer traffic to and from your Harvesters. Failure to do so can result in link saturation during plot transfers and your main node falling offline as a result.
On all of the servers I put host entries in /etc/hosts for the INTERNAL ip address of each of the servers. I use 10Gbe connections on the back and I want all of the plots to be moved across this network. By creating a separate network (10.200.95.x/24 in my example) without a default gateway, I can guarantee the only traffic on that network is plots being moved around and nothing else.
You could have an entire discussion on network performance and the install script will offer to make some changes for you to your networking parameters if you like. What I have found is that my scripts will generally saturate a 10Gbe link without issue but once you load down your plotter and Harvesters/NAS with massive CPU, memory and I/O tasks, you really don't get utilization of the full 10Gbe. At max CPU load it tends to take between 4 and 7 minutes to move a plot from my plotter to my NAS. Your network may vary.
To get started
I recommend installing in /root/plot_manager. If you would like to install elsewhere that is fine, if you want to use a virtual environment, that should work as well. I have not personally tried running these outside of /root/plot_manager but so long as you have the basic directory structure under your install directory, it should work out of the box.
Assuming a clean install, you can try this:
git clone https://github.com/rjsears/chia_plot_manager.git && mv chia_plot_manager plot_manager && cd plot_manager && chmod +x install.sh && ./install.sh help
If you are upgrding from a previous version, simply mv plot_manager plot_manager.old and then run the command above.
My final directory structure looks like this:
/root/plot_manager
├── export
├── extras
├── logs
├── test_plots
├── utilities
└── web
Plotter Configuration
Here is the directry structure I use on my plotter for my main plotting and -d drives:
/mnt
├── nvme
│   ├── drive0
│   ├── drive1
│   ├── drive2
│   └── drive3
└── ssdraid
    └── array0
The /mnt/nvme/driveX drives are used as my temp drives for plotting. These are Intel DC P4510 NVMe drives capable of running 13 to 15 plots each (based on k32 plot size). The /mnt/ssdraid/array0 is my -d drive. This is a RAID0 array of HGST 1.6TB Enterprise SSD drives. This is where the completed plots are stored before they are moved by the plot_manager.py script.
While all of my actual plotting is done as the chia user, I store all of my scripts at /root/plot_manager I do have a little bit of testing built into the script and that is what the test_plots directory is used for. I simple dd 10G of zeros into a test plot file and turn on testing in the script to test everything before going live. Eventually I will add a lot more testing capability, but that is down the road.
Update plot_manager.py Configuration File (generally /root/.config/plot_manager/plot_manager.yaml)
Beginning with Version 0.9, I attempt to autodetect your install path automatically so there is a lot less to do in this version than in previous versions. However you do need to make some changes in plot_manager.yaml. Most of these are pretty easy to figure out. Take a look at the file plot_manager_skel.yaml for more information and for complete instruction on how to set your configuration options.
NAS Configuration
The NAS setup is pretty unique to me but it should be pretty easy to reconfigure the script to meet other needs.
Coming from running three very large Plex systems (PBs worth), I designed my drive layout and naming so that I could at any moment just by looking at a mountpoint go pull a drive if I needed to do so.
My basic layout is a single SuperMicro storage server with motherboard, 256GB ram and 36 drive bays. This I call enclosure0. This is a Supermicro 847, it has 24 drive bays in front and 12 in the rear. This is my directory structure for that system:
/mnt/enclosure0
├── front
│   ├── column0
│   │   ├── drive0
│   │   ├── drive1
│   │   ├── drive2
│   │   ├── drive3
│   │   ├── drive4
│   │   └── drive5
│   ├── column1
│   │   ├── drive6
│   │   ├── drive7
│   │   ├── drive8
│   │   ├── drive9
│   │   ├── drive10
│   │   └── drive11
│   ├── column2
│   │   ├── drive12
│   │   ├── drive13
│   │   ├── drive14
│   │   ├── drive15
│   │   ├── drive16
│   │   └── drive17
│   └── column3
│       ├── drive18
│       ├── drive19
│       ├── drive20
│       ├── drive21
│       ├── drive22
│       └── drive23
└── rear
    ├── column0
    │   ├── drive24
    │   ├── drive25
    │   └── drive26
    ├── column1
    │   ├── drive27
    │   ├── drive28
    │   └── drive29
    ├── column2
    │   ├── drive30
    │   ├── drive31
    │   └── drive32
    └── column3
        ├── drive33
        ├── drive34
        └── drive35
As you can see just by looking at a mount point I can tell exactly where a drive is located in my system. In addition to that, when I add additional external drive arrays, I just do the same thing with enclosure1, enclosure2, etc and my drive_manager.py script will work no problem. I plug in a new drive, format it XFS, mount it, add it to fstab and that's it. The script does everything else.
I am basically using psutil to get drive space information and then use that to determine where to put plots. When I call psutil I just tell it I want it to look at any device that starts with /dev/sd and any mountpoint that includes enclosure and ends with the word drive:
if p.device.startswith('/dev/sd') and p.mountpoint.startswith('/mnt/enclosure') and p.mountpoint.endswith(drive):
In this manner I will never get swap, temp, boot, home, etc. Nothing at all but my plot storage drives. In order for this to work with your setup, you would have to modify all of these lines to match your paticular configuration.
Once you have that figured out, there are just a couple of other little things that need to be set and configured. All configuration items are now stored in a central yaml configuration file located at /root/.config/plot_manager.yaml. There are instruction also located in that directory. If you upgrade to a new version, simply run the install script and it will update your configuration file to the newest settings without changing anything you currently have set.
OK, once you have everything setup, on the plotter you simply run the plot_manager.py script and if everything is setup correctly you should see something like the following:
2021-03-19 19:20:01,543 - plot_manager:92 - process_plot: DEBUG process_plot() Started
2021-03-19 19:20:01,543 - plot_manager:126 - process_control: DEBUG process_control() called with [check_status] and [0]
2021-03-19 19:20:01,543 - plot_manager:158 - process_control: DEBUG Checkfile Does Not Exist
2021-03-19 19:20:01,543 - plot_manager:74 - get_list_of_plots: DEBUG get_list_of_plots() Started
2021-03-19 19:20:01,544 - plot_manager:77 - get_list_of_plots: DEBUG plot-k32-2021-03-18-02-33-xxx.plot
2021-03-19 19:20:01,544 - plot_manager:82 - get_list_of_plots: INFO We will process this plot next: plot-k32-2021-03-18-02-33-xxx.plot
2021-03-19 19:20:01,545 - plot_manager:126 - process_control: DEBUG process_control() called with [set_status] and [start]
2021-03-19 19:20:02,228 - plot_manager:98 - process_plot: INFO Processing Plot: /mnt/ssdraid/array0/plot-k32-2021-03-18-02-33-xxx.plot
2021-03-19 19:25:00,697 - plot_manager:165 - verify_plot_move: DEBUG verify_plot_move() Started
2021-03-19 19:25:01,433 - plot_manager:171 - verify_plot_move: DEBUG Verifing: chianas01-internal: /mnt/enclosure0/front/column3/drive18/plot-k32-2021-03-18-02-33-xxx.plot
2021-03-19 19:25:02,102 - plot_manager:176 - verify_plot_move: DEBUG Remote Plot Size Reported as: 108898704182
2021-03-19 19:25:02,103 - plot_manager:178 - verify_plot_move: DEBUG Local Plot Size Reported as: 108898704182
2021-03-19 19:25:02,103 - plot_manager:101 - process_plot: INFO Plot Sizes Match, we have a good plot move!
2021-03-19 19:25:02,103 - plot_manager:126 - process_control: DEBUG process_control() called with [set_status] and [stop]
2021-03-19 19:25:03,465 - plot_manager:147 - process_control: DEBUG Remote nc kill called!
2021-03-19 19:25:06,741 - plot_manager:109 - process_plot: INFO Removing: /mnt/ssdraid/array0/plot-k32-2021-03-18-02-33-xxx.plot
This tells you that everything has gone smoothly. You should be able to log into your NAS and verify that the plot is where it is supposed to be. Needless to say I would stick with a bunch of test plots until I had it right, I would also comment out this line:
os.remove(plot_path)
Until you are absolutely certain it is running the way that you would like it to run!
Now on the NAS server, I run my script once per minute. This is what you should see if everything is going well:
drive_manager:258 - update_receive_plot: DEBUG update_receive_plot() Started
drive_manager:266 - update_receive_plot: DEBUG Currently Configured Plot Drive: /mnt/enclosure0/front/column3/drive18
drive_manager:267 - update_receive_plot: DEBUG System Selected Plot Drive:      /mnt/enclosure0/front/column3/drive18
drive_manager:268 - update_receive_plot: DEBUG Configured and Selected Drives Match!
drive_manager:269 - update_receive_plot: DEBUG No changes necessary to /root/plot_manager/receive_plot.sh
drive_manager:270 - update_receive_plot: DEBUG Plots left available on configured plotting drive: 58
Notifications
If you want to receive votifications, you need to properly configure your local MTA (install.sh install postfix by default) and test it. In addition, if you want to use Pushbullet ot receive SMS text messages via Twillio you need to configure those accounts and then update system_info.py with the correct account information. Failure to do so will result in you not getting any notifications.
Once you have notifications setup and tested:
When the plot drives does change, you get a nicely formatted email:
Server: chianas01
New Plot Drive Selected at 10:17:17
Previous Plotting Drive............................../mnt/enclosure0/front/column2/drive17
# of Plots on Previous Plotting Drive................56
New Plotting Drive (by mountpoint).................../mnt/enclosure0/front/column2/drive17
New Plotting Drive (by device)......................./dev/sdq1
Drive Size...........................................10.9T
# of Plots on we can put on this Drive...............53

Environmental & Health
Drive Serial Number..................................00000000
Current Drive Temperature............................31°C
Last Smart Test Health Assessment....................PASS

Other Information
Total Plots on chianas01.............................1691
Current Total Number of Plot Drives..................24
Number of k32 Plots until full.......................925
Max # of Plots with current # of Drives..............2640
Approx. # of Days to fill all Plot Drives............16
and a text or pushbullet message:
Plot Drive Updated: Was: /mnt/enclosure0/front/column3/drive17, Now: /mnt/enclosure0/front/column3/drive18
And if you choose, once a day you can get a daily update email:
NAS Server: chianas01
Daily Update Email - Generated at 22:15:46
Current Plotting Drive (by mountpoint)..................../mnt/enclosure0/front/column3/drive22
Current Plotting Drive (by device)......................../dev/sdw1
Drive Size................................................10.9T

Environmental & Health
Drive Serial Number.......................................00000000
Current Drive Temperature.................................25°C
Last Smart Test Health Assessment.........................PASS

Other Information
Total Plots on chianas01..................................2944
Current Total Number of Plot Drives.......................44
Number of k32 Plots until full............................1852
Max # of Plots with current # of Drives...................4840
Plots Being Farmed as reported by Chia....................2939
Total Plot Space in use as reported by Chia...............291 TiB

Plotting Speed
Total Plots Last 24 Hours.................................79
Average Plots Per Hour....................................3.3
Average Plotting Speed Last 24 Hours......................7.979 TiB/Day
Approx. # of Days to fill all Plot Drives.................23
If you are using your NAS as a local plotter as well, read this.....
I also use my NAS/Harvester as a local plotter as well, and I need to be able to manage the plots that are created just as I do the remote plots. I use `Plotman` to manage the creation of my plots but it is not really designed with a setup like mine. You can point it to a single rsync location but you have to manage that plot on your own once it gets there. The `-d` drive you point `Plotman` at does not get monitored by `Plotman` (or chia for that matter) and so I learned the hard way that those drives can fill up and cause all of your plotting to fail. So I created `move_local_plots.py`.This script is very simple, it looks in the location you tell it you are storing completed local plots and moves them to the currently selected plotting drive that is configured by `drive_manager.py`. It then verifies the plot sizes and deletes the plot from the monitored drive. It an attempt to verify that the copy is taking place and not failed, I utilize `Dstat` and a simple shell script that looks at the I/O on the drive you are moving the plot off of. If there is no I/O on the drive, it is assumed that there is no copy process. If the script detects that it thinks there is a copy going on yet there is no drive I/O, it attempts to reset itself and restart the copy, hopefully completing correctly this time around.
Make sure you install `Dstat` before trying to use this script otherwise it will fail. See the beginning of the script for settings.
One word of advice - if you are using one of your drives that `drive_manager.py` would normally use to place plots on as a temp local `-d` drive, you should offline the drive using the `./drive_manager.py --off drivexx` command, otherwise `drive_manager.py` could start placing plots on that drive causing issues.
Command Line Options
Staring with V0.3 (April 4th, 2021) (and updated once again in V0.94) I have started to add in command line options to make getting plot and other information easier and to generate reports on the fly. Currently the command line options that are availare are:
- -h or --help
- -v or --version
- -ct or --check_temps
- -pr or --plot_report
- -fr or --farm_report
- -ud or --update_daily
- -rp or --replace-plot
- -uuid or --check_uuid
- -off or --offline_hdd
- -on or --online_hdd
-h --help and -v --version
These options print out the help message or version information and exits.
Welcome to drive_manager.py Version: 0.94 (2021-08-08)
usage: drive_manager.py [-h] [-v] [-dr] [-ct] [-pr] [-fr] [-ud] [-rp] [-uuid CHECK_UUID] [-off OFFLINE_HDD]

            ******** ChiaNAS Drive Manager - 0.94 (2021-08-08) ********
Running drive_manager.py with no arguments causes drive_manager to run in 'normal' mode.
In this mode drive_manager will check the drive utilization and update which drive your
Chia plots will be sent to when they arrive from your plotter. This is generally called
from a cronjob on a regular basis. Please read the full information about how it works
on my github page.

There are several commandline switches you can use to get immediate reports and feedback:

-dr or --drive_report       Runs the Daily ChiaNAS Report (if configured), and emails
                            it to you. This can be called from a crontab job as well.

-ct or --check_temps        This will query all of your hard drives using smartctl and
                            return a list of drive temperatures to you.

-pr or --plot_report        This queries the NAS and returns a report letting you know
                            how many plots are currently on the system and how many more
                            you can add based on the current drive configuration. It also
                            includes plotting speed information for the last 24 hours.

-fr or --farm_report        This queries your farm and returns a report letting you know
                            how many plots are currently in the farm and how many more
                            you can add based on the current drive configuration. It also
                            includes plotting speed information for the last 24 hours farm wide.
                            **NOTE: Must be configured!

-ud or --update_daily       This updates the total number of plots the system has created
                            over the past 24 hours. Use with CAUTION!. This should be ran
                            from crontab once every 24 hours only! It updates the total
                            from the last time is was run until now, hence why you should
                            only run this once per 24 hours.

-rp or --replace_plot       This is GENERALLY run remotely by your plotter when it detects
                            that you are configured for plot replacement, ie - you have a
                            lot of old plots and you are replacing them with new portable
                            style plots. Use CAUTION running it manually! It might DELETE
                            an old plot every time it is run but should only do so if
                            there is no space available on the selected drive.

-uuid or --check_uuid       This checks all remote harvesters to see if the requested UUID is
                            present and mounted. Returns the server and mountpoint if found.

-off or --offline_hdd       This takes a drive as it's input (for example  drive6) and
                            "offlines" it so that no more plots will get written to it.
                            You must --on or --online_hdd the drive for it to be used
                            again. Useful if the drive is failing and needs to be replaced.
                            You cannot "offline a drive that is not mounted.

-on or --online_hdd         This takes a drive as it's input (for example  drive6) and
                            "onlines" it so that plots will get written to it. This option
                            will be UNAVAILABLE if there are no drives that have been
                            offlined!

USAGE:

optional arguments:
  -h, --help            show this help message and exit
  -v, --version         show program's version number and exit
  -dr, --daily_report   Run the ChiaPlot Daily Email Report and exit
  -ct, --check_temps    Return a list of drives and their temperatures and exit
  -pr, --plot_report    Return the total # of plots on the system and total you can add and exit
  -fr, --farm_report    Return the total # of plots on your entire farm and total you can add and exit
  -ud, --update_daily   Updates 24 hour plot count. USE WITH CAUTION, USE WITH CRONTAB
  -rp, --replace_plot   Remove a single old Plot. USE WITH CAUTION, READ DOCS FIRST. Generally called remotely by Plotter!
  -uuid CHECK_UUID, --check_uuid CHECK_UUID
                        Check to see is a specific UUID is mounted on any harvester
  -off OFFLINE_HDD, --offline_hdd OFFLINE_HDD
                        Offline a specific drive. Use drive number: drive6
-dr --drive_report
This option outputs the HTML version of the Daily Drive Report email to the screen and also emails.
This only works if configured. If this notification is set to off, this will do nothing.
-ct --check_temps
This options prints the serial number, device name, drive number and temperature of all devices desiginated as plot drives.
#################################################################
################# chianas01 Temperature Report ##################
#################################################################
#    Serial#     #     Device     #     Drive     #    Temp     #
#################################################################
#   00000000     #   /dev/sdb1    #    drive0    #     28°C     #
#   00000000     #   /dev/sdc1    #    drive1    #     29°C     #
#   00000000     #   /dev/sdd1    #    drive2    #     28°C     #
#   00000000     #   /dev/sde1    #    drive3    #     28°C     #
#   00000000     #   /dev/sdf1    #    drive4    #     27°C     #
#   00000000     #   /dev/sdg1    #    drive5    #     24°C     #
#   00000000     #   /dev/sdh1    #    drive6    #     30°C     #
#   00000000     #   /dev/sdi1    #    drive7    #     30°C     #
#   00000000     #   /dev/sdj1    #    drive8    #     29°C     #
#   00000000     #   /dev/sdk1    #    drive9    #     28°C     #
#   00000000     #   /dev/sdl1    #    drive10    #     27°C     #
#   00000000     #   /dev/sdm1    #    drive11    #     24°C     #
#   00000000     #   /dev/sdn1    #    drive12    #     29°C     #
#   00000000     #   /dev/sdo1    #    drive13    #     30°C     #
#   00000000     #   /dev/sdp1    #    drive14    #     30°C     #
#   00000000     #   /dev/sdq1    #    drive15    #     29°C     #
#   00000000     #   /dev/sdr1    #    drive16    #     27°C     #
#   00000000     #   /dev/sds1    #    drive17    #     25°C     #
#   00000000     #   /dev/sdt1    #    drive18    #     28°C     #
#   00000000     #   /dev/sdu1    #    drive19    #     30°C     #
#   00000000     #   /dev/sdv1    #    drive20    #     29°C     #
#   00000000     #   /dev/sdw1    #    drive21    #     29°C     #
#   00000000     #   /dev/sdx1    #    drive22    #     28°C     #
#   00000000     #   /dev/sdy1    #    drive23    #     25°C     #
#   00000000     #   /dev/sdz1    #    drive24    #     32°C     #
#   00000000     #   /dev/sdaa1    #    drive25    #     33°C     #
#   00000000     #   /dev/sdab1    #    drive26    #     32°C     #
#   00000000     #   /dev/sdac1    #    drive27    #     34°C     #
#   00000000     #   /dev/sdad1    #    drive28    #     35°C     #
#   00000000     #   /dev/sdae1    #    drive29    #     33°C     #
#   00000000     #   /dev/sdaf1    #    drive30    #     29°C     #
#   00000000     #   /dev/sdag1    #    drive31    #     30°C     #
#   00000000     #   /dev/sdah1    #    drive32    #     30°C     #
###################################################################
-pr --plot_report
This options prints out a quick version of the daily plot report to the screen
and exits.
############################################################
################### chianas01 Plot Report ##################
############################################################
Total Number of Plots on chianas01:                     2943
Total Number of Plots Chia is Farming:                  2943
Total Amount of Drive Space (TiB) Chia is Farming:       291
Total Number of Systemwide Plots Drives:                  44
Total Number of k32 Plots until full:                   1853
Maximum # of plots when full:                           4840
Plots completed in the last 24 Hours:                     79
Average Plots per Hours:                                 3.3
Average Plotting Speed Last 24 Hours (TiB/Day):         7.98
Appx Number of Days to fill all current plot drives:      23
Current Plot Storage Drive:                        /dev/sdw1
Temperature of Current Plot Drive:                      26°C
Latest Smart Drive Assessment of Plot Drive:            PASS
############################################################
If you are running in plot_replacement mode you will see the following instead:
############################################################
################### chianas01 Plot Report ##################
############################################################
######### *** OLD PLOT REPLACEMENT IN PROGRESS *** #########
############################################################
Total Number of Plots on chianas01:                     8716
Total Number of OLD Plots on chianas01:                 8352
Total Number of PORTABLE Plots on chianas01:             373
Total Number of Plots Chia is Farming:                  8705
Total Amount of Drive Space (TiB) Chia is Farming:       862
Total Number of Systemwide Plots Drives:                  81
Total Number of k32 Plots until full:                   115
Maximum # of plots when full:                           8908
Plots completed in the last 24 Hours:                     53
Average Plots per Hours:                                 2.2
Average Plotting Speed Last 24 Hours (TiB/Day):         5.35
Days to fill/replace all current drives/plots:         160.0
Current Plot Storage Drive:                       /dev/sday1
Temperature of Current Plot Drive:                      35°C
Latest Smart Drive Assessment of Plot Drive:            PASS
############################################################
-fr --farm_report
This options prints out a full farm daily plot report to the screen
and exits.
############################################################
################### Farm Wide Plot Report ##################
############################################################
Total Number of Plots on Farm:                          7043
Total Number of Plots Chia is Farming:                  7032
Total Amount of Drive Space (TiB) Chia is Farming:       696
Total Number of Systemwide Plots Drives:                 122
Total Number of k32 Plots until full:                   6082
Maximum # of plots when full:                          13230
Plots completed in the last 24 Hours:                    236
Average Plots per Hours:                                  10
Average Plotting Speed Last 24 Hours (TiB/Day):           24
Appx Number of Days to fill all current plot drives:      26
############################################################
################ chianas01 Harvester Report ################
############################################################
Total number of plots on chianas01:                    6624
Plots completed in the last 24 hours:                  131
Average Plotting Speed Last 24 Hours (Tib/Day):        13.23
Appx # of Days to fill all drives on this harvester:   8
############################################################
################ chianas02 Harvester Report ################
############################################################
Total number of plots on chianas02:                    287
Plots completed in the last 24 hours:                  44
Average Plotting Speed Last 24 Hours (Tib/Day):        4.44
Appx # of Days to fill all drives on this harvester:   77
############################################################
################ chianas03 Harvester Report ################
############################################################
Total number of plots on chianas03:                    132
Plots completed in the last 24 hours:                  61
Average Plotting Speed Last 24 Hours (Tib/Day):        6.16
Appx # of Days to fill all drives on this harvester:   26
############################################################
In plot-replacement mode, report looks like this:
Welcome to drive_manager.py Version: 0.94 (2021-08-08)

############################################################
################### Farm Wide Plot Report ##################
############################################################
Total Number of Plots on Farm:                         22933
Total Number of Plots Chia is Farming:                 22886
Total Amount of Drive Space (TiB) Chia is Farming:      2265
Total Number of Systemwide Plots Drives:                 242
Total Number of k32 Plots until full:                  22168
Maximum # of plots when full:                          25860
Plots completed in the last 24 Hours:                    200
Average Plots per Hour:                                    8
Average Plotting Speed Last 24 Hours (TiB/Day):           20
Appx Number of Days to fill/replace plots/drives:        111
############################################################
################ chianas01 Harvester Report ################
############################################################
Replace Non-Pool Plots:                               Active
Total Number of OLD Plots on chianas01:                 8219
Total Number of PORTABLE Plots on chianas01:             507
Total number of plots on chianas01:                     8718
Plots completed in the last 24 hours:                    141
Average Plotting Speed Last 24 Hours (Tib/Day):        14.24
Appx # of Days to replace all plots on chianas01:         59
############################################################
################ chianas02 Harvester Report ################
############################################################
Replace Non-Pool Plots:                               Active
Total Number of OLD Plots on chianas02:                 3705
Total Number of PORTABLE Plots on chianas02:             400
Total number of plots on chianas02:                     3706
Plots completed in the last 24 hours:                    100
Average Plotting Speed Last 24 Hours (Tib/Day):          4.2
Appx # of Days to replace all plots on chianas02:         37
############################################################
-uuid --check_uuid
This options searches all configured harvesters for a specific UUID and returns
the harvester and mountpoint where it was found:
root@chianas01:~/plot_manager# ./drive_manager.py -uuid fa1eb1f5-ff48-4fcd-b4d1-be2e556654ad
Welcome to drive_manager.py Version: 0.94 (2021-08-08)

Please wait while we search all harvesters for fa1eb1f5-ff48-4fcd-b4d1-be2e556654ad

############################################################
################### UUID Search Report #####################
############################################################
UUID:          fa1eb1f5-ff48-4fcd-b4d1-be2e556654ad
Status:        LOCATED
Harvester:     chianas08
Mount Point:   /mnt/enclosure0/rear/column1/drive28
############################################################

OR

############################################################
################### UUID Search Report #####################
############################################################
UUID:          fa1eb1f5-ff48-4fcd-b4d1-be2e556654ad
Status:        NOT LOCATED
############################################################
-ud --update_daily
This option is really designed to be called from your crontab right before you run your daily email:
01 00 * * * cd /root/plot_manager && /usr/bin/python3 /root/plot_manager/drive_manager.py -ud >/dev/null 2>&1
02 00 * * * cd /root/plot_manager && /usr/bin/python3 /root/plot_manager/drive_manager.py -dr >/dev/null 2>&1
It is designed to calculate the information necessary for the daily plot report. You can run it anytime
you want but it will reset this information to the point in time you called it as oppoed to giving you
a 24 hour view of your system.
Coin Monitor (Only Chia Version 1.1.1 or Higher)
I wanted a simple way to keep track of when I won coins and how many I had so I added coin_monitor.py to the mix.
As I said, in my configuration I have three servers, my plotter, my nas and my farmer. Coin Monitor sits on my
farmer and watches the log files for new coins. When it sees that there is a new coin, it checks the coin logfile
(/root/coin_monitor/logs/new_coins.log) to make sure we have not already counted those coins. If it is a new coin
it writes that coin information to the logfile (new_coins.log) and depending on what notifications you have setup
you can receive a notification via SMS, Email and PushBullet. If you have per_coin_email set to True/1 in
coin_monitoring_config you will also receive a nicely formatted email on top of your other notifications.

This is stand alone and can be used in combination with or without my plot_manager scripts.
Installation is pretty straight forward. Copy it into your preferred directory and then edit coinf_monitor.py and make
sure that this line is pointing to your correct log file location:
chia_log = '/home/chia/.chia/mainnet/log/debug.log'
Also make sure the following line is also correct for your system:
new_coin_log = '/root/coin_monitor/logs/new_coins.log'
Lastly, you need to make sure chia is logging in INFO mode and not WARNING otherwise it will not log new coins.
Look here to verify:
/home/chia/.chia/mainnet/config/config.yaml
You should see something like this:
logging: &id001
    log_filename: log/debug.log
    log_level: INFO
    log_stdout: false
Just make sure the log_level is set to INFO and you should be good.
If you would like to test the script, simply create a test "log" file and put this line in it:
2021-04-24T14:16:11.298 wallet chia.wallet.wallet_state_manager: INFO Confirmed balance amount is 9200000000000
Save the file and edit the coin_monitor.py script to look at that file and run the script. If everything
is configured correctly you should get an email (or whatever notification you set up). If you run it again
you should see this in the coin_monitor debug log:
coin_monitor:82 - check_for_chia_coins: DEBUG: Found coins that were already accounted for in the log!: ['2021-04-24T14:16:11.298', '9200000000000']
Just make sure to point the script back to the correct logfile after testing!
Hardware I used in my setup
I have had a couple of people ask about the hardware that I used in my setup so I thought I would include it here.
Almost everything I purchased was used off eBay. There were minor exceptions but 95% was eBay.
Plotting Server
Dell R820
4 x E5-4657L V2 CPUs (48 Cores, 96 Threads)
512GB DDR3 1600Mhz RAM
Dell 4 x NVMe Drive Cage and Controller
4 x 4TB Intel P4510 NVMe Drives (temp drives)
LSI 9431-8i 12Gbs SAS Controller
8 x HGST 1.6TB SAS3 12Gbs SSDs (5.8 PBW) (HUSMR1616ASS205)
(2 in RAID1 for OS, 6 x RAID0 as -d drive)
2 x 10Gbe & 2x 1Gbe NICs
iDrac Enterprise
Dual Power Supplies
NAS for Plot Storage
Supermicro 4U 36 Bay SAS3 Chassis w/X10DRi-T4+ Motherboard
2 x E5-2690 v4 CPU
128GB ECC
1 x AOC-S3008L-8LE 12GB/s SAS3 Controller (IT Mode)
2 x LSI9300-16e 12GB/s External (IT Mode)
36 x 12TB Seagate Exos Drives
10Gbe NICs (on motherboard)
Dual Power Supplies
NAS Expansion Chassis
2 x SuperMicro 847 45-Drive Chassis
Dual Power supplies
Chia Famer Node
Ubuntu 20.04 LTS VM running on Proxmox
My extra drive chassis are empty right now, but as you can see from my drive layout and mounting
strategy above, it is super easy to add more drives.
Changelog
V0.93 2021-07-08
- Added ability to identify plots as
portable(setpooling: Truein config file)
and all new plots will be prepended withportable.. Eventually I will add in
the ability to overwrite old plots with new plots during new pooling plot creation.
This ASSUMES 1.2.0 and has nothing to do with the plotting itself, just (as always)
with the management of the plots.
V0.9 2021-05-28
- Added full multi-harvester capabilities to
plot_manager.pyalong
with host checks for all harvesters prior to attempting a plot move. - Reworked all scripts to auto detect installation path and remove
the necessity to make a bunch of path changes in the scripts. - Various bug fixes and other small enhancements.
V0.8 2021-05-24
-
Added Multi-Harvester Reporting. Once configured across all harvesters
you can run a farm report from any of your harvesters. Outputs all of
your harvester data to a json file which is then grabbed when you run
the report. Utilizes Paramiko to manage the sftp connection between
the harvesters. If you want to utilize this, please be sure to read
the instructions below. -
Added additional command line utility to drive_manager.py:
- -fr or --farm_report Quick total Farm Report outputs to screen
V0.7 2021-05-17
- Minor bug fixes and spelling error corrections.
- Additional of
auto_drive.pyscript.
V0.6 2021-04-22
- Minor updates to
move_local_plots.pyto utilize Disk I/O to verify that
we have not stalled a plot move. Attempts to auto correct and restart the
copy/move process if we detect a failure. - Added plot checking via Chia logs to match against how many plots are
currently reported as being on the system. Also included total drive space
in use by Chia. - Updated the plot report as well as the Daily Report with above plot
information. It is not uncommon for there to be a little difference in the
numbers as a result of moves/copies in progress, etc. But if the number is
more than say 5 or 6 plots, you might want to check your logs for other
issues.
V0.5 2021-04-22
- Added ability to manage locally plotted plots in addition to remote plots.
This allow you to plot on your NAS/Harvester and have those plots managed
much like the plots from a remote system. This is set up as a separate
script calledmove_local_plots.py. Please see the notes in that script
for more information.
V0.4 2021-04-13
- Added ability to "offline" a particular drive for maintenance. When you offline
a drive it prevents drive_manager.py from using that drive to store plots
until you "online" it again. - Only drives that are currently mounted and available on the system and listed
as plot drives can be offlined. - Only drives that have been offlined can be onlined. If you run
./drive_manager.py -h
you will get a list of drives that have been offlined. If no drives have been
offlined you will not see the-onor--online_hddoptions. - Modified the sorting option for all plots drives using
natsort. This sorts now
completely on drive number naturally. -offor--offline_hddOfflines a particular drive for maintenance, Error to stdout
if drive is not mounted or not aplot drive.-onor--online_hddOnline a drive that has been offlined making it immediately
available for plots. Only drives that have been offline will be listed.
V0.3 2021-04-04
Added multiple command line utilities to drive_manager.py including:
-dror--drive_reportImmediately runs the Daily Report and sends email (if configured).-ctor--check_tempsChecks the temperatures of all drives and returns a report to stdout.-pror--plot_reportQuick plot report like email report but to stdout.-udor--update_dailyDesigned to be called from cron one per 24-hours. Updates the
daily plot stats to provide 24 hours plotting stats (total plots, hourly plots, days until full).
Added plot time informtion to the dailey email report including:
- Total plots last 24 hours
- Average plots per hour (last 24 hours)
- Average plotting speed (last 24 hours)
V0.2 2021-03-23
- Moved system logging types to plot_manager_config and updated necessary functions.
- Added per_plot system notification function (send_new_plot_notification()).
- Updated read_config_data() to support ConfigParser boolean returns.
- Updated necessary functions for read_config_data() change


