TIGER
TIGER is a Python toolbox to conduct graph vulnerability and robustness research. TIGER contains numerous state-of-the-art methods to help users conduct graph vulnerability and robustness analysis on graph structured data. Specifically, TIGER helps users:
- Quantify network vulnerability and robustness,
- Simulate a variety of network attacks, cascading failures and spread of dissemination of entities
- Augment a network's structure to resist attacks and recover from failure
- Regulate the dissemination of entities on a network (e.g., viruses, propaganda).
Setup
To quickly get started, install TIGER using pip
$ pip install graph-tiger
Alternatively, you can clone TIGER and create a new Anaconda environment
using the YAML file.
Citing
If you find TIGER useful in your research, please consider citing the following paper:
@article{freitas2020evaluating,
    title={Evaluating Graph Vulnerability and Robustness using TIGER},
    author={Freitas, Scott and Chau, Duen Horng},
    journal={arXiv preprint arXiv:2006.05648},
    year={2020}
}
Quick Examples
EX 1. Calculate graph robustness (e.g., spectral radius, effective resistance)
from graph_tiger.measures import run_measure
from graph_tiger.graphs import graph_loader

graph = graph_loader(graph_type='BA', n=1000, seed=1)

spectral_radius = run_measure(graph, measure='spectral_radius')
print("Spectral radius:", spectral_radius)

effective_resistance = run_measure(graph, measure='effective_resistance')
print("Effective resistance:", effective_resistance)
EX 2. Run a cascading failure simulation on a Barabasi Albert graph
from graph_tiger.cascading import Cascading
from graph_tiger.graphs import graph_loader

graph = graph_loader('BA', n=400, seed=1)

params = {
    'runs': 1,
    'steps': 100,
    'seed': 1,

    'l': 0.8,
    'r': 0.2,
    'c': int(0.1 * len(graph)),

    'k_a': 30,
    'attack': 'rb_node',
    'attack_approx': int(0.1 * len(graph)),

    'k_d': 0,
    'defense': None,

    'robust_measure': 'largest_connected_component',

    'plot_transition': True,  # False turns off key simulation image "snapshots"
    'gif_animation': False,  # True creaets a video of the simulation (MP4 file)
    'gif_snaps': False,  # True saves each frame of the simulation as an image

    'edge_style': 'bundled',
    'node_style': 'force_atlas',
    'fa_iter': 2000,
}

cascading = Cascading(graph, **params)
results = cascading.run_simulation()

cascading.plot_results(results)
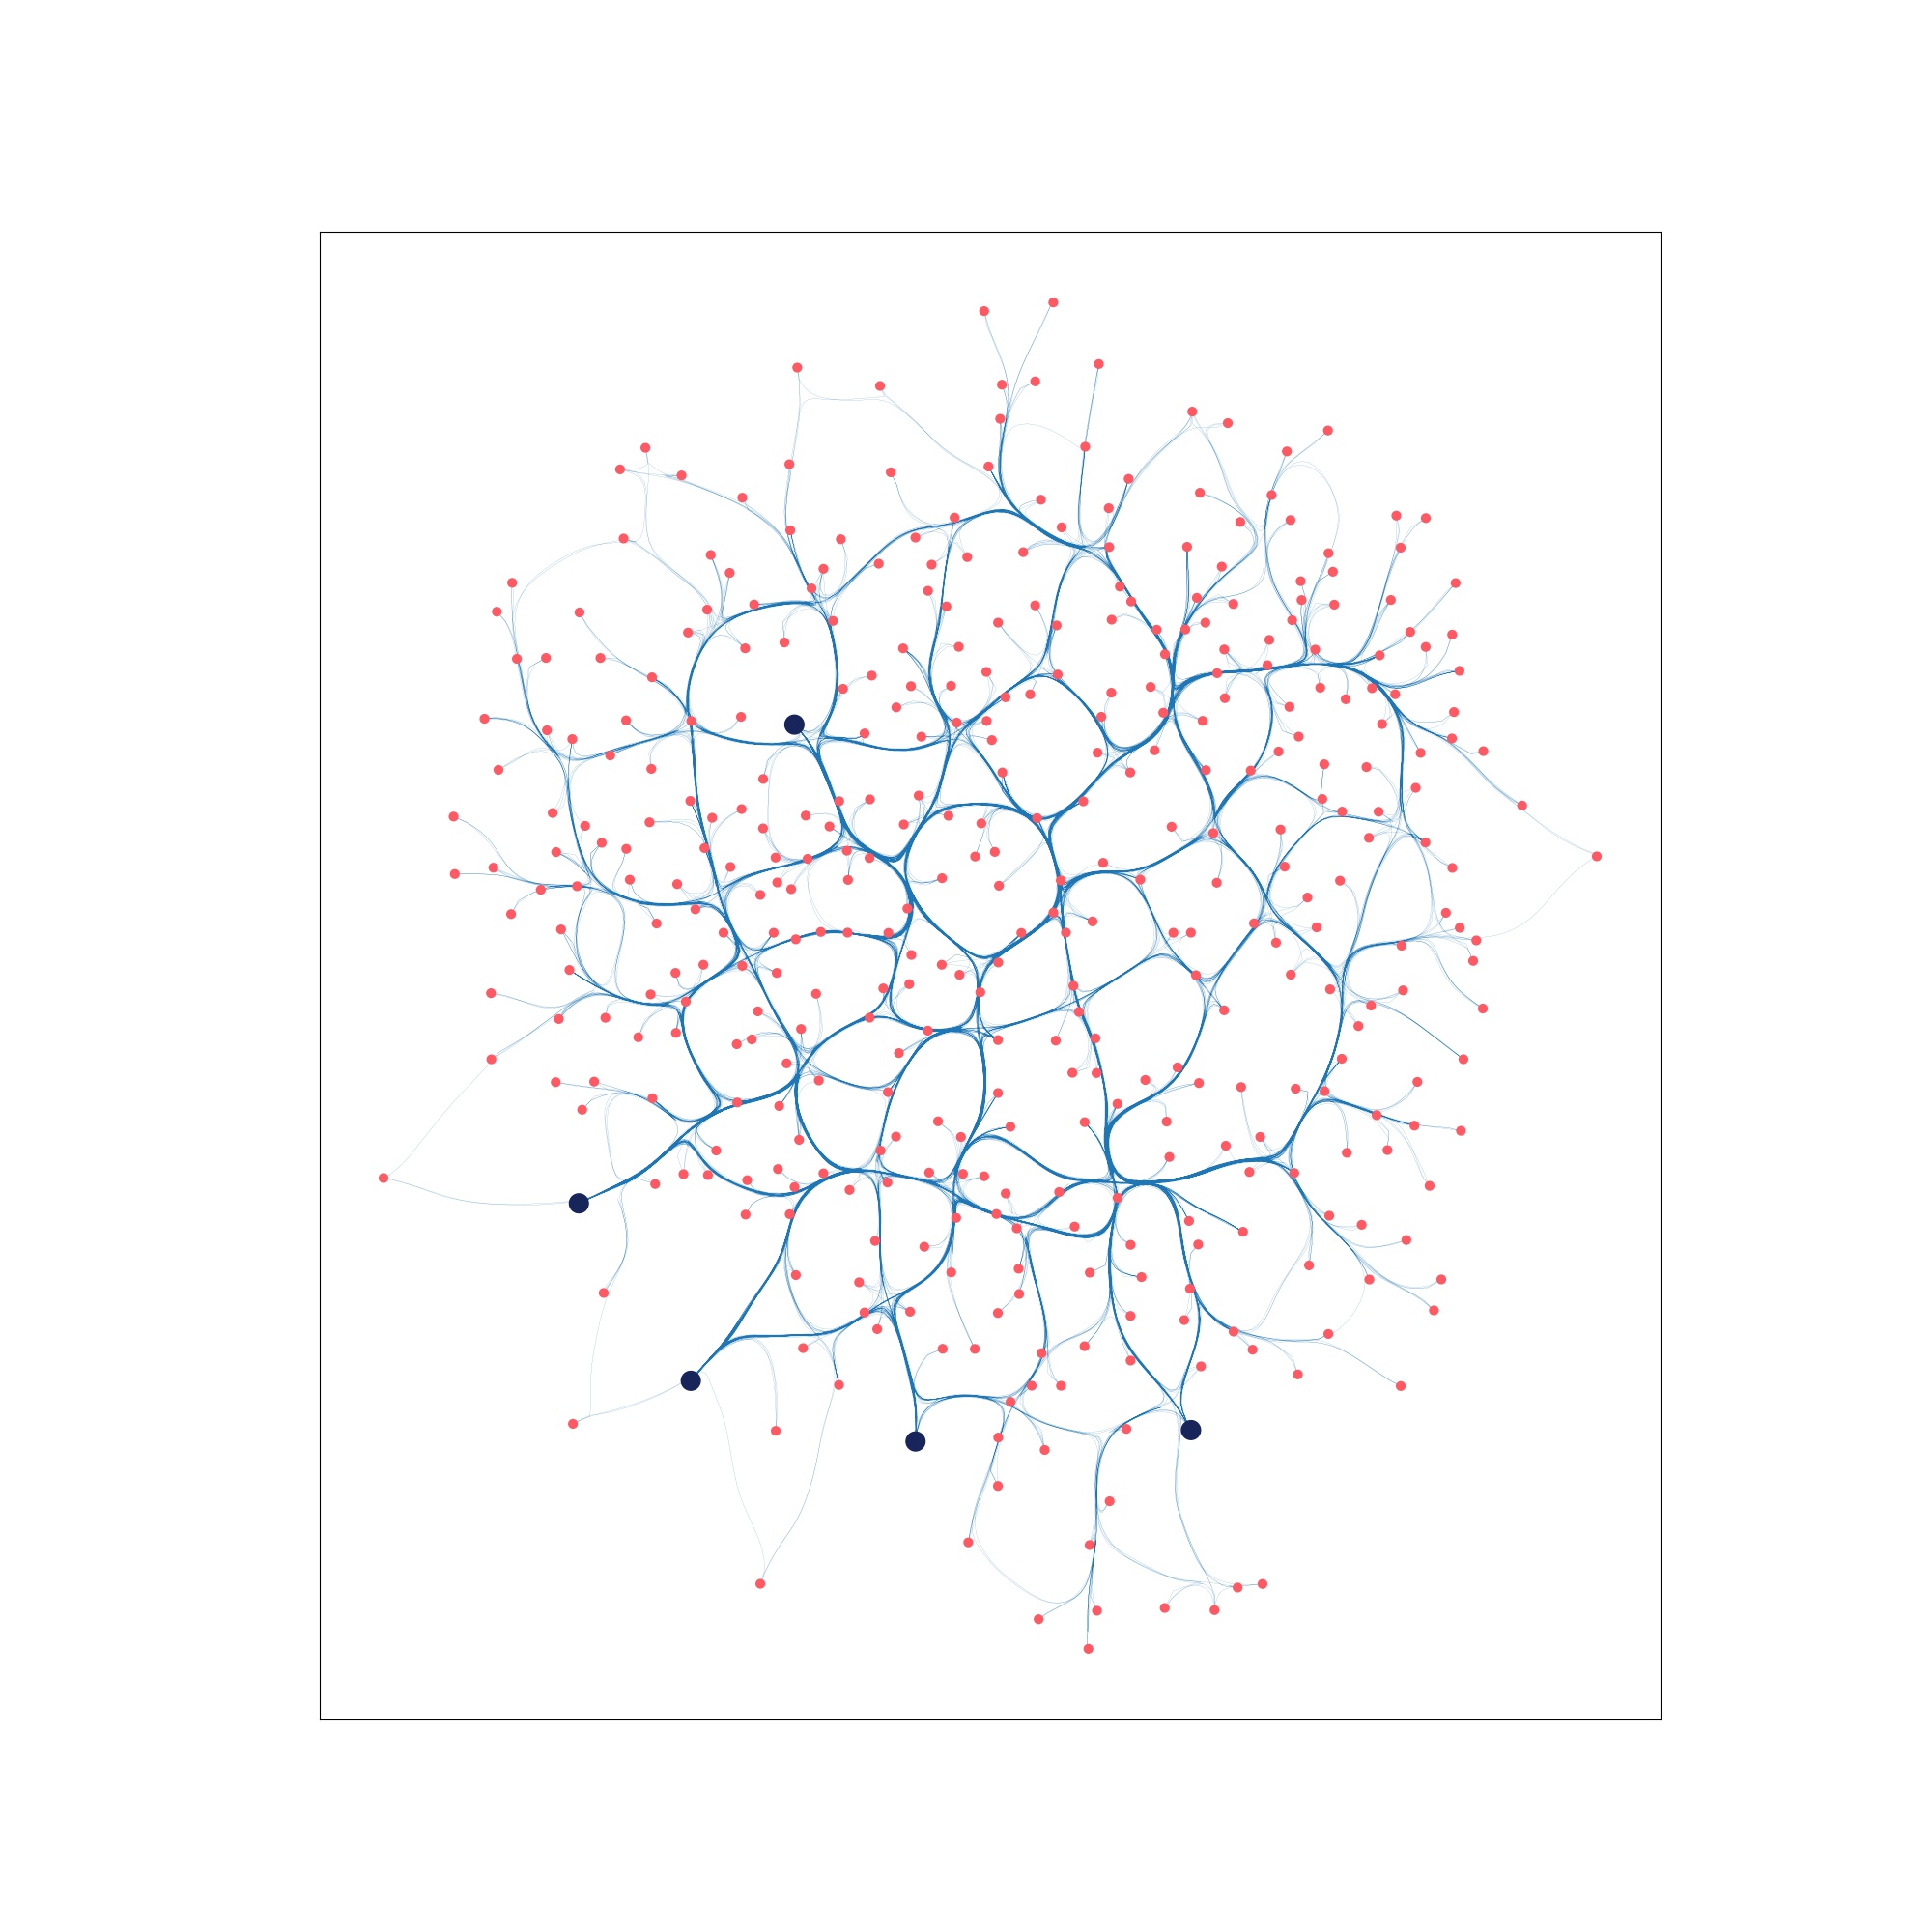
| Step 0: Network pre-attack | Step 6: Beginning of cascading failure | Step 99: Collapse of network |
|---|---|---|
 |
 |
 |
EX 3. Run an SIS virus simulation on a Barabasi Albert graph
from graph_tiger.diffusion import Diffusion
from graph_tiger.graphs import graph_loader

graph = graph_loader('BA', n=400, seed=1)


sis_params = {
    'model': 'SIS',
    'b': 0.001,
    'd': 0.01,
    'c': 1,

    'runs': 1,
    'steps': 5000,
    'seed': 1,

    'diffusion': 'min',
    'method': 'ns_node',
    'k': 5,

    'plot_transition': True,
    'gif_animation': False,

    'edge_style': 'bundled',
    'node_style': 'force_atlas',
    'fa_iter': 2000
}

diffusion = Diffusion(graph, **sis_params)
results = diffusion.run_simulation()

diffusion.plot_results(results)
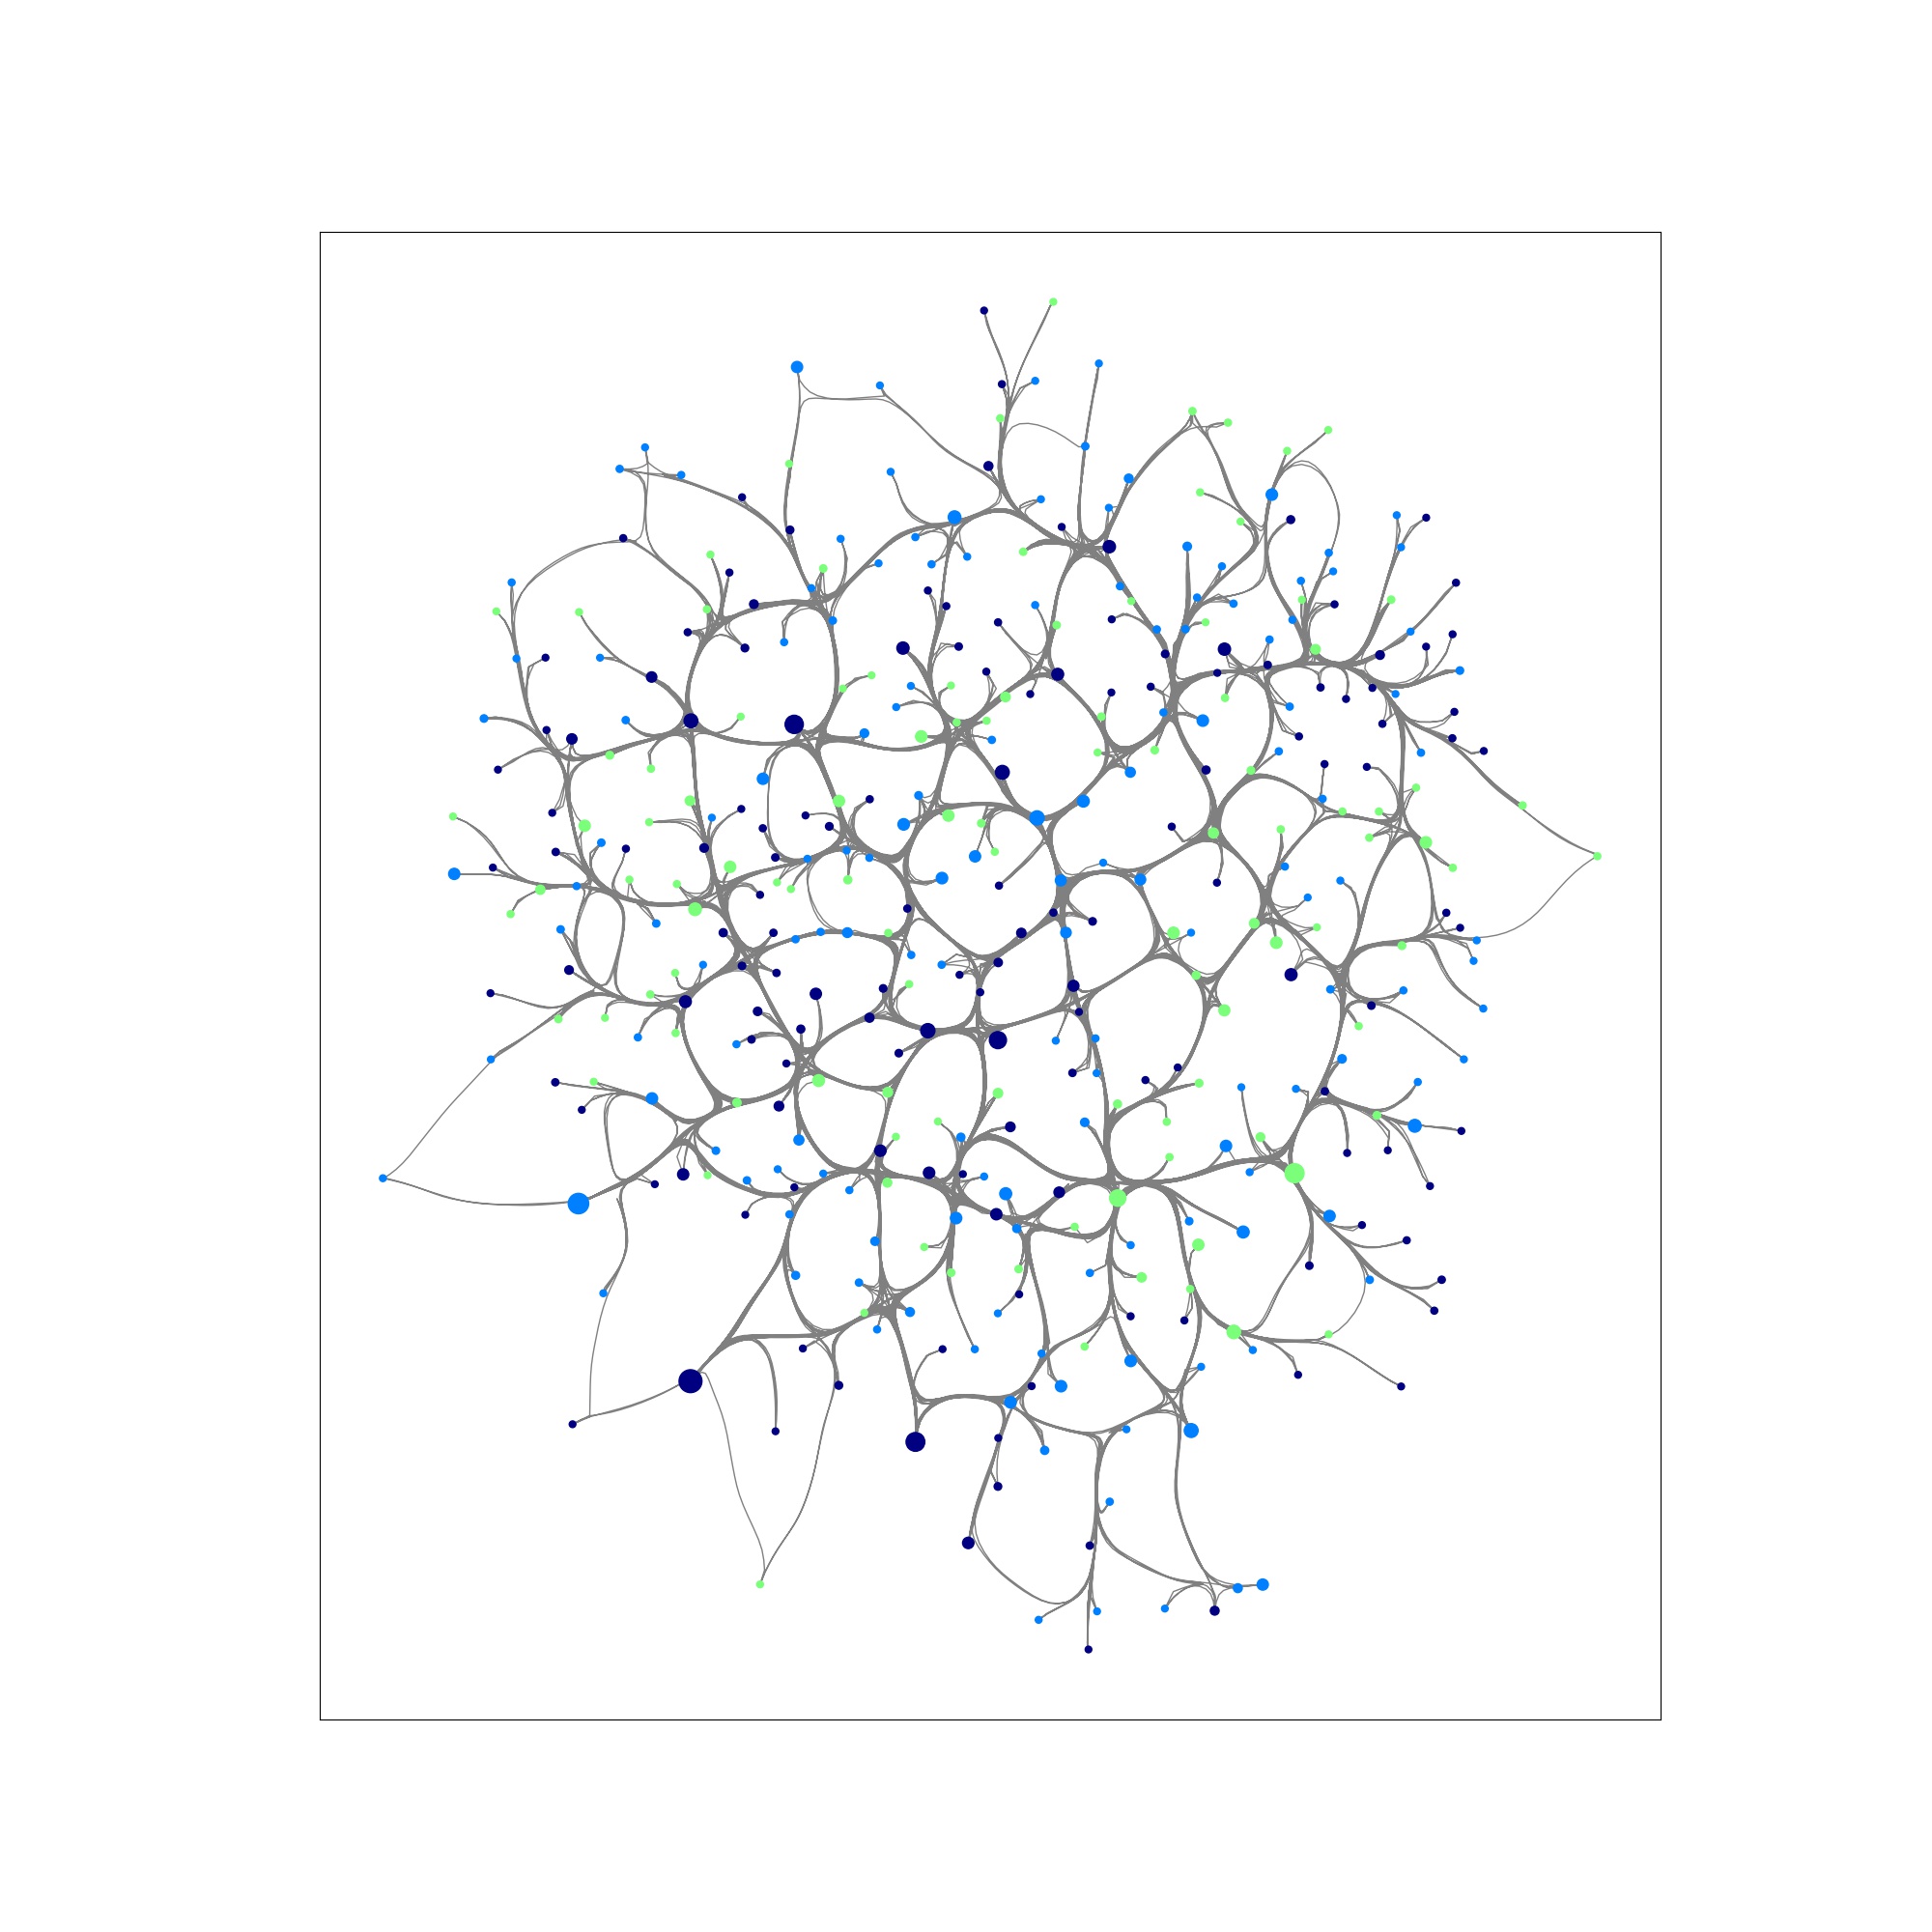
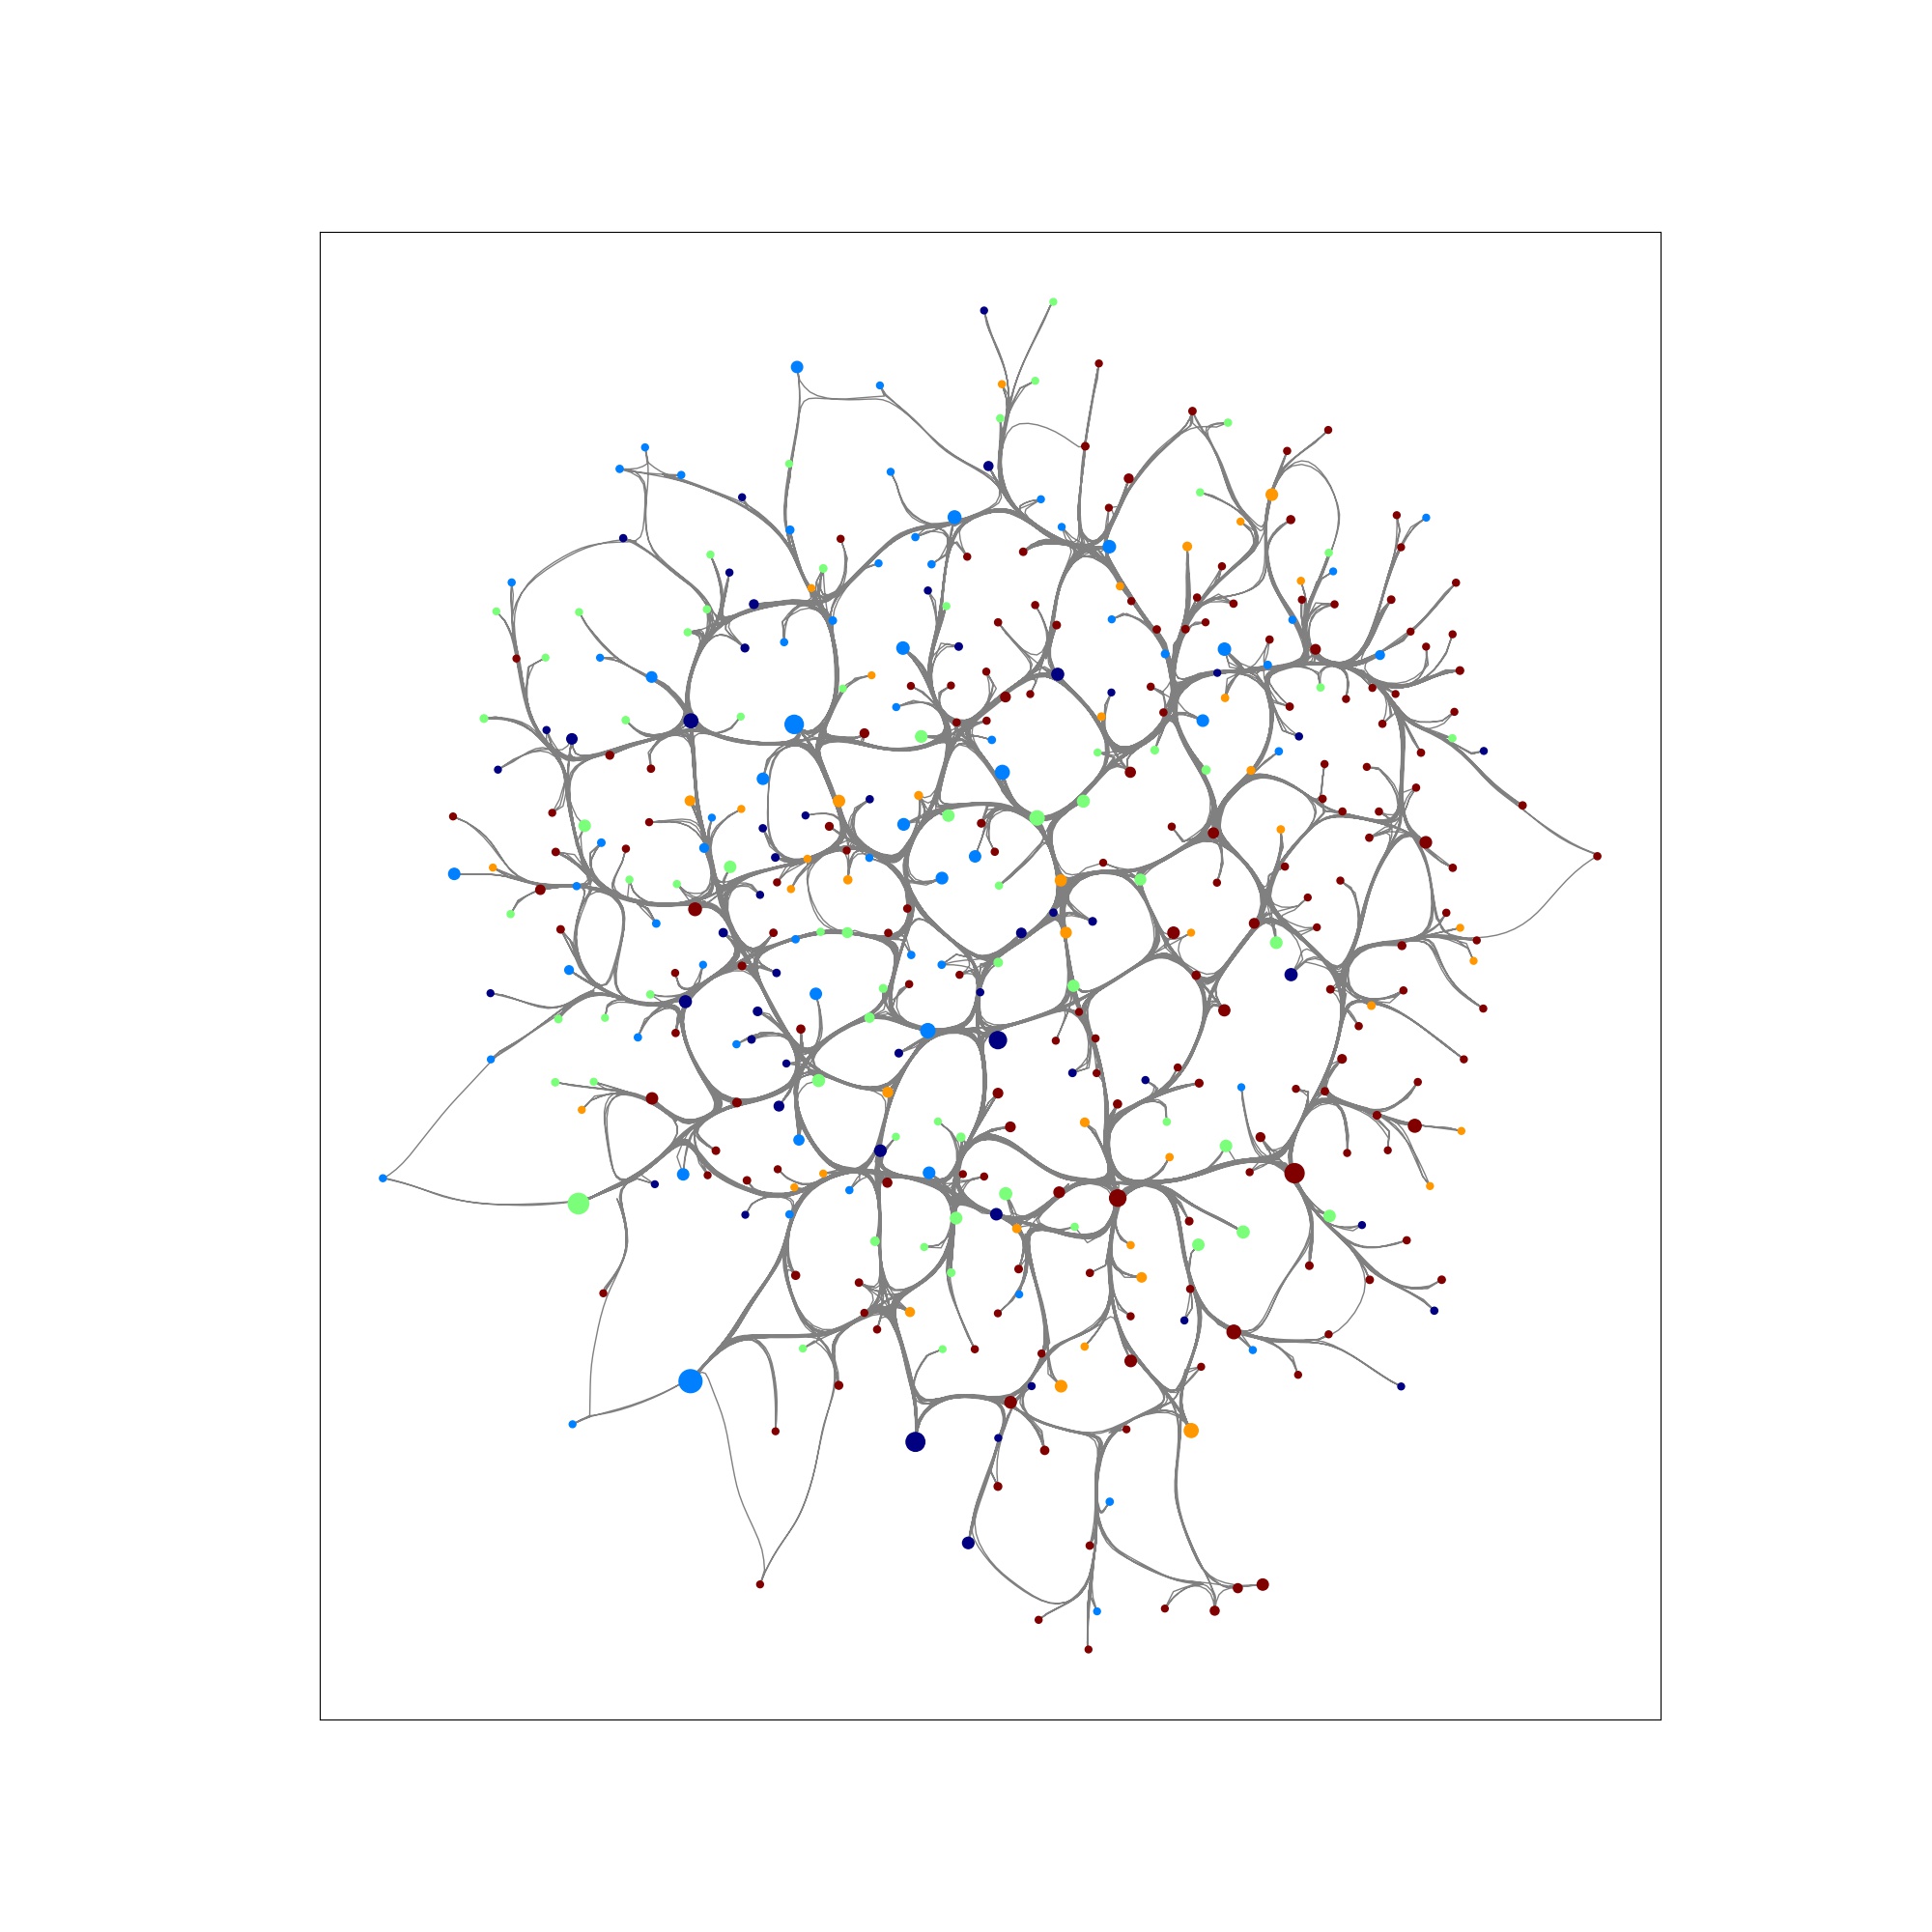
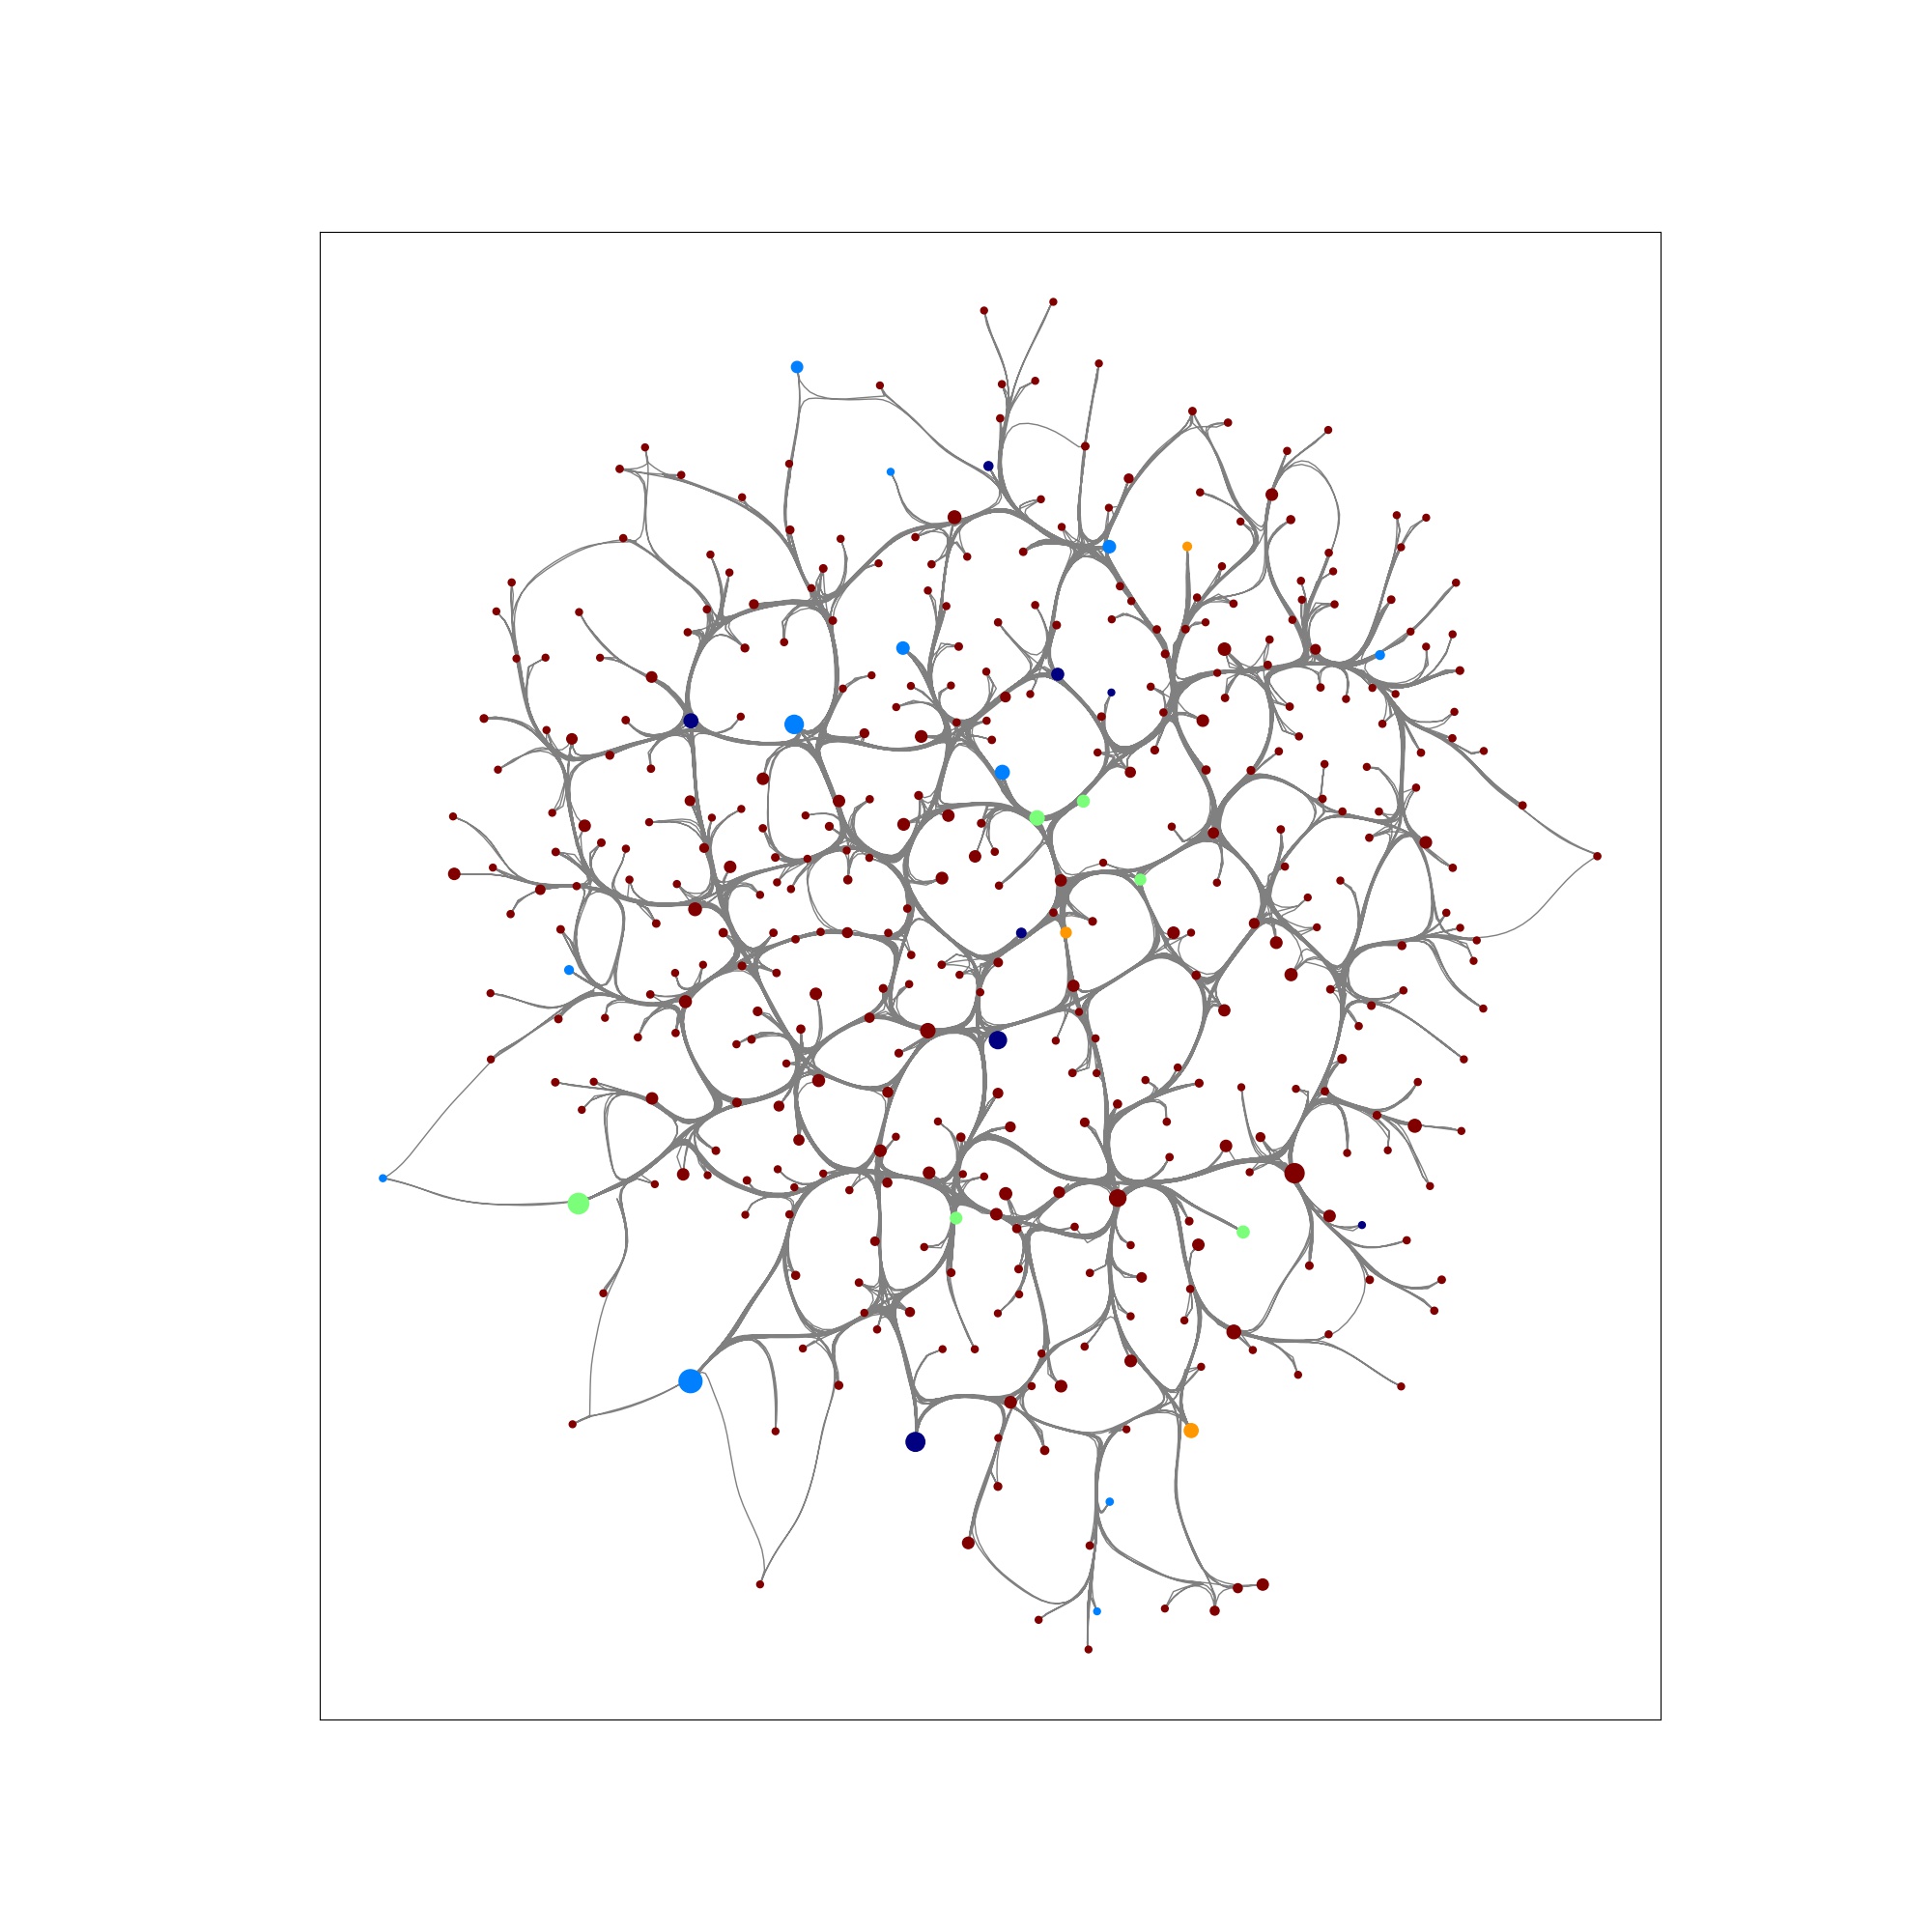
| Step 0: Virus infected network | Step 80: Partially infected network | Step 4999: Virus contained |
|---|---|---|
 |
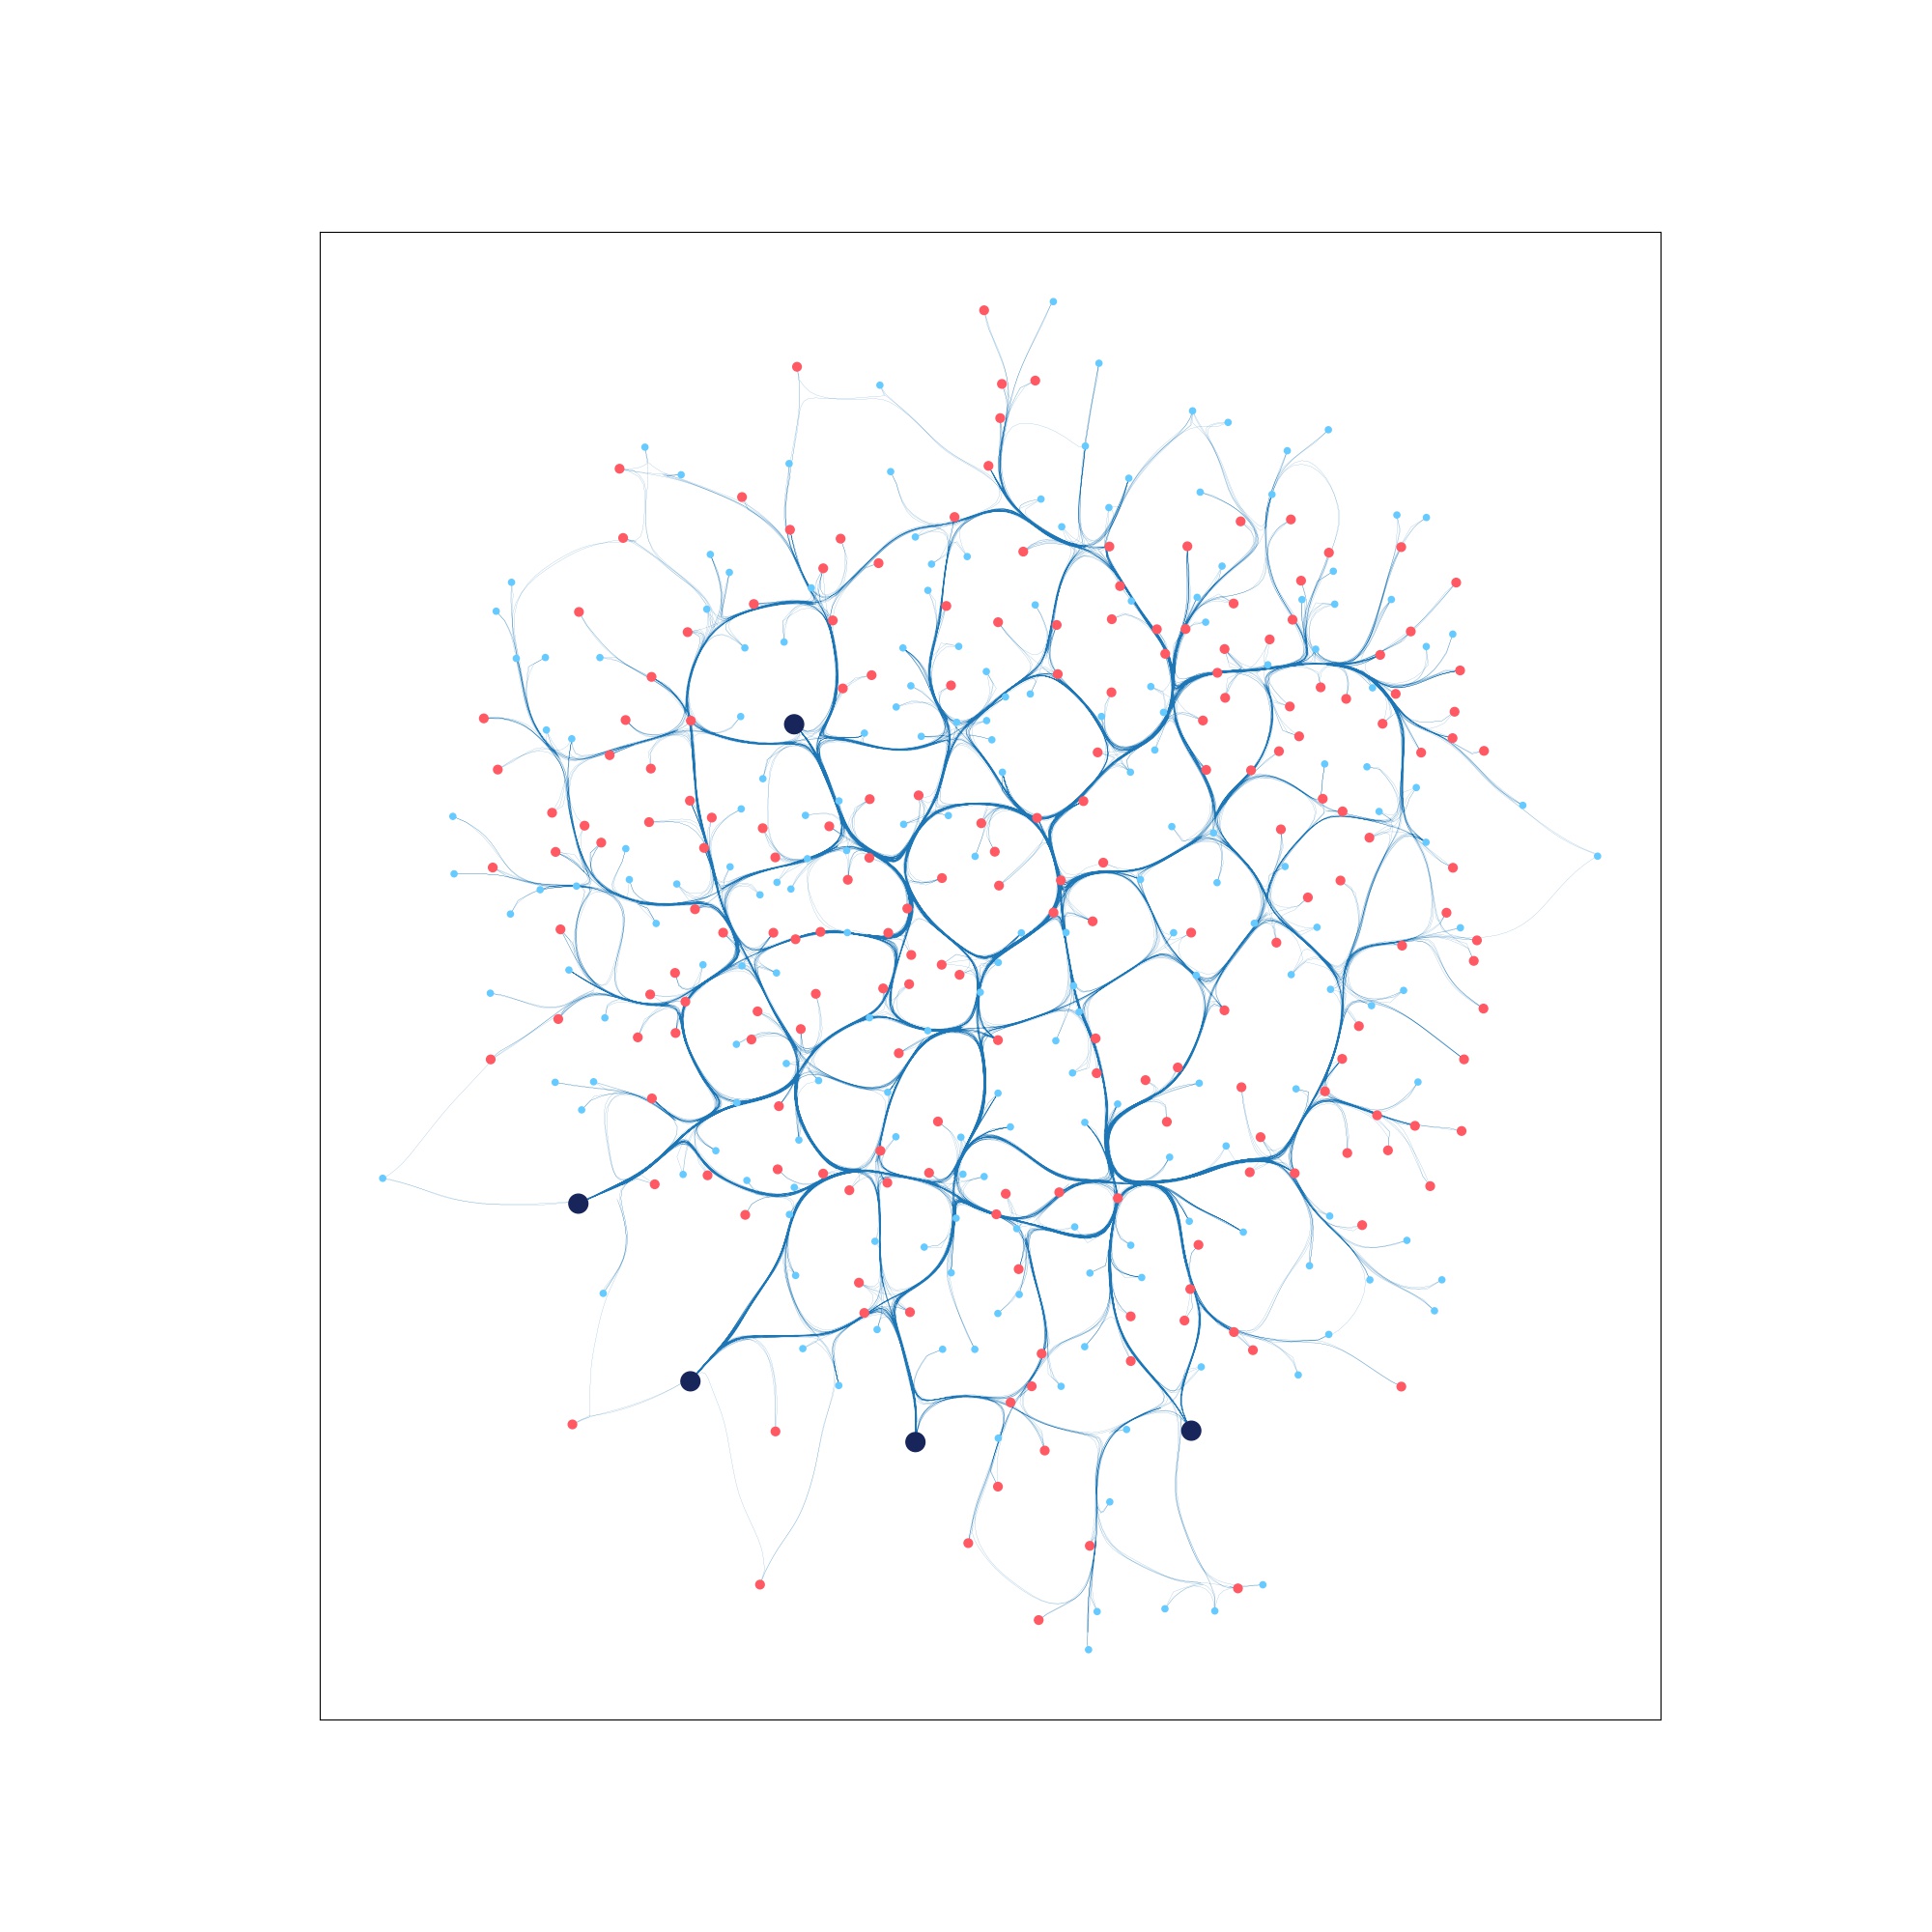 |
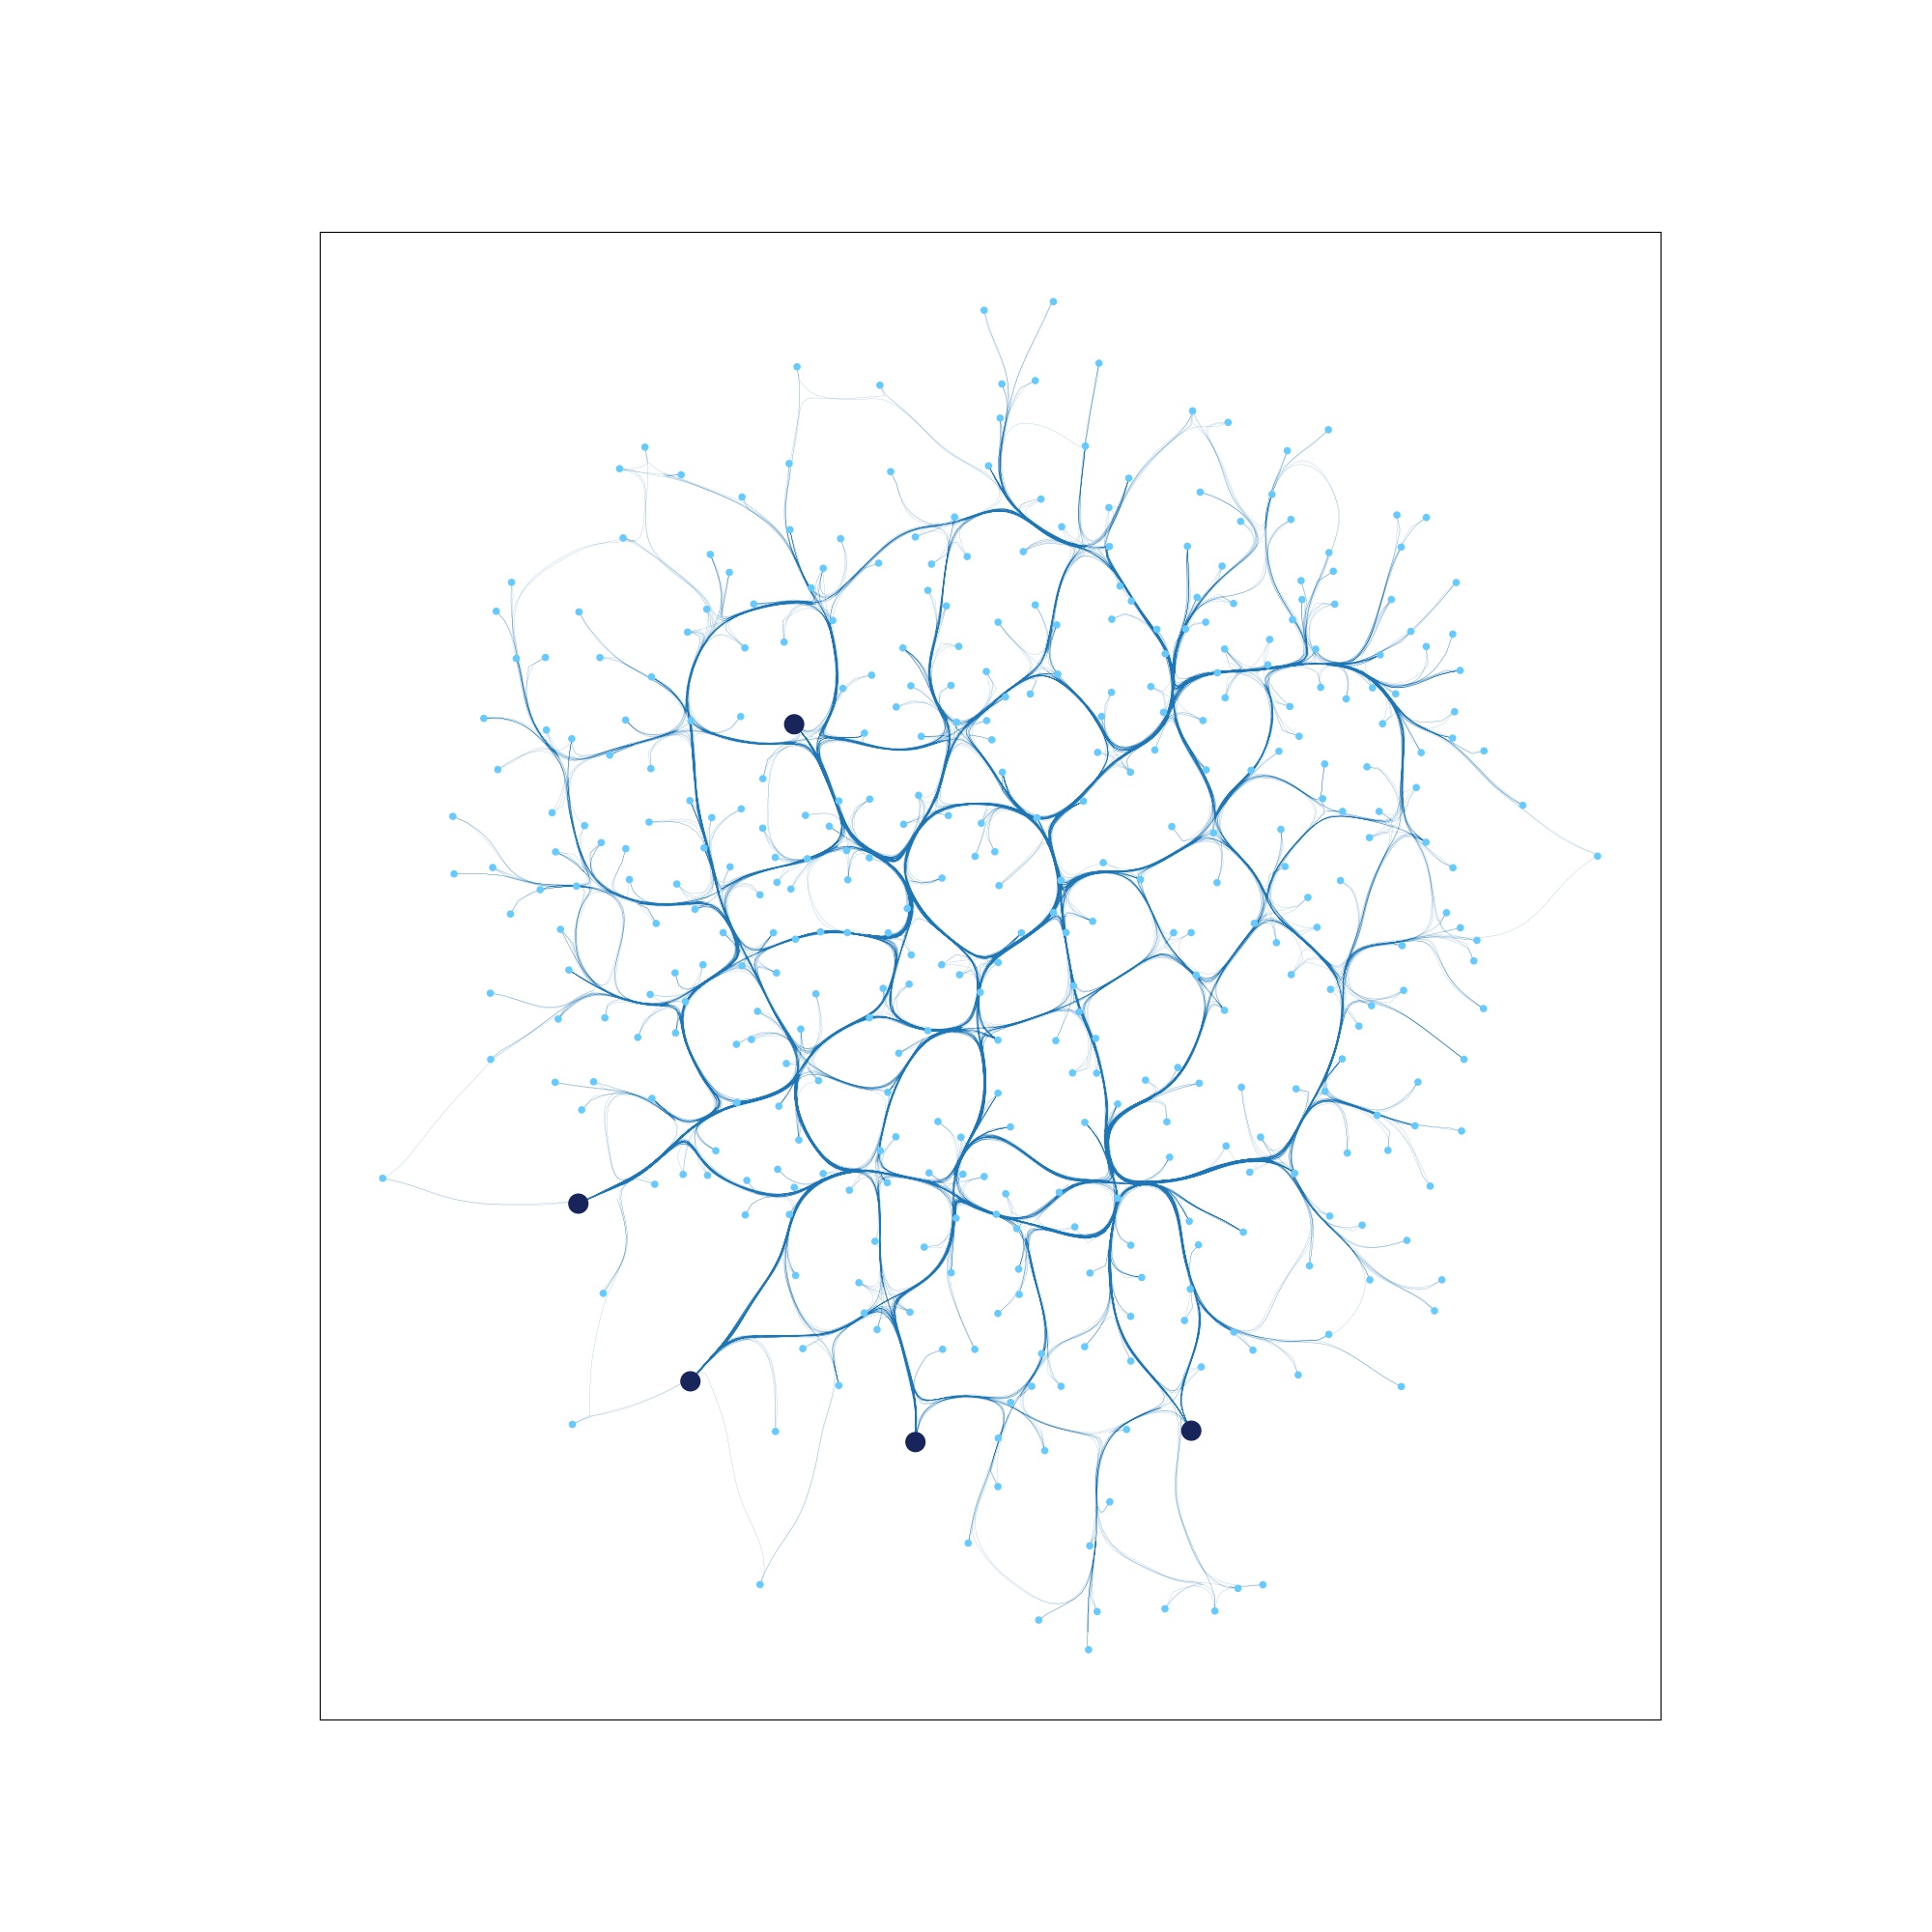 |


