pointnet_pytorch
This is the pytorch implementation of PointNet on semantic segmentation task. The project achieves the same result as official tensorflow version on S3DIS dataset. We release the code for related researches using pytorch.
Environment
-
Ubuntu 16.04
-
python3.5
-
pytorch0.3.1
Folder structure
.
├── data_preparation
│   ├── collect_indoor3d_data.py  <-- generate numpy files from original S3DIS dataset
│   ├── gen_indoor3d_h5.py  <-- generate h5py files from numpy files
│   ├── data_prep_util.py
│   ├── indoor3d_util.py
│   ├── meta
│   │   ├── all_anno_paths.txt
│   │   ├── all_data_label.txt
│   │   ├── area5_anno_paths.txt
│   │   ├── area5_data_label.txt
│   │   └── class_names.txt
│   ├── Stanford3dDataset_v1.2_Aligned_Version  <-- original S3DIS dataset
│   └── s3dis_npy  <-- generated numpy files
├── download_data.sh
├── indoor3d_sem_seg_hdf5_data  <-- training data(downloaded by download_data.sh)
├── train_ptn.py
├── inference_ptn.py
├── eval_iou_acc.py
├── model
│   ├── pointnet.py
└── utils
    ├── indoor3d_util.py
    └── train_utils.py
├── README.md
Training
Download S3DIS dataset
Download the preprocessed S3DIS dataset provided by charlesq34 using the following shell scripts:
sh download_data.sh
Train
We follow the six-folder validation of the official version. WHile training, we choose one area as the test set(here is Area_5).
CUDA_VISIBLE_DEVICES=0 python train_ptn.py --test_area 5
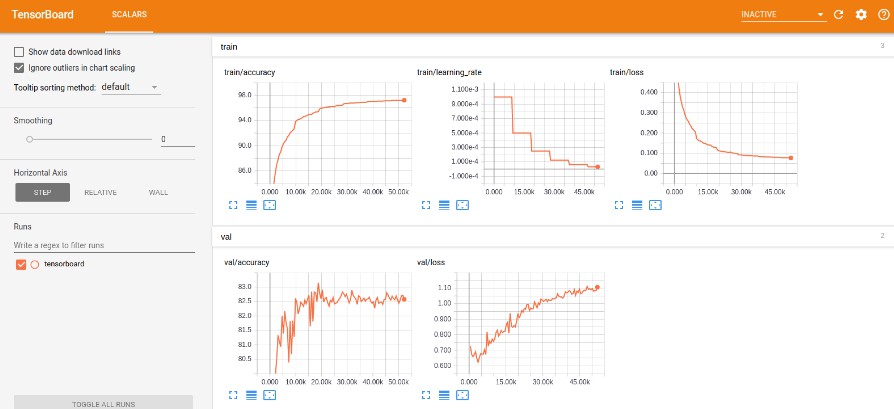
The training result will be stored in a folder called log_ptn. We provide tensorboard visualization using tensorboardX.
Evaluation and Visualization
Data preparation for Evaluation
If you just want to get the evaluation result without visualization, the train_ptn.py can provide you the accuracy of the test set. However, if you want to visualize the scene with semantic labels, you need to do the following preparation.
You need to download the original S3DIS Dataset. Then you run the following code to generate the numpy file for each scene.
cd data_preparation
python collect_indoor3d_data.py
Inference
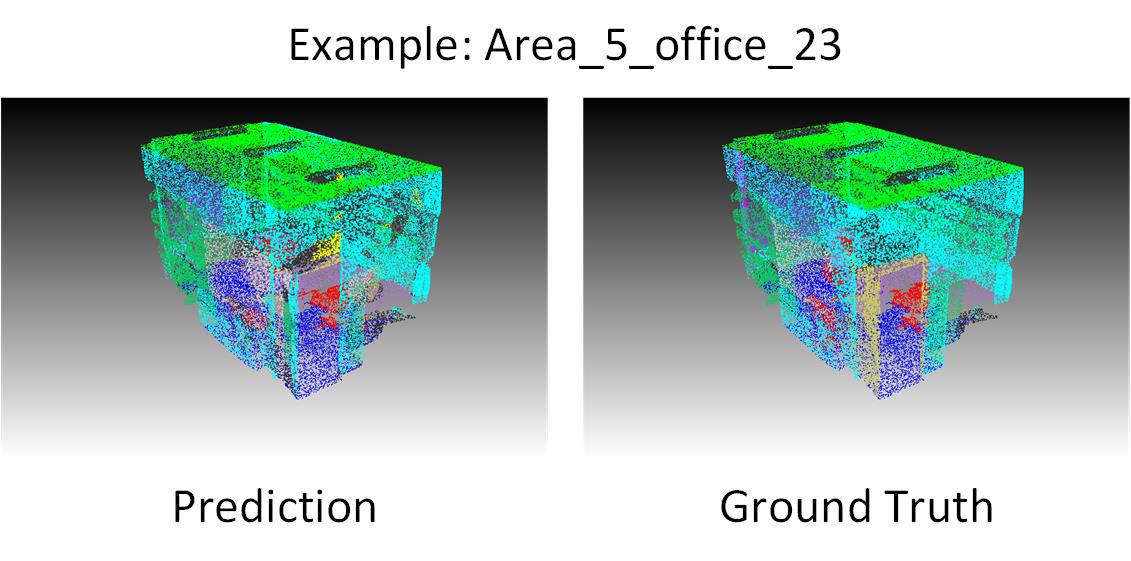
After generating the numpy file, you can run the inference code to get the prediction. The official version visualizes the semantic scene in obj file and we keep the same. The obj file can be opened using meshlab.
CUDA_VISIBLE_DEVICES=0 python inference_ptn.py --weight_file log_ptn/train/2018-10-08-21-17-07/checkpoint/checkpoint_95.pth.tar --room_data_filelist data_preparation/meta/area5_data_label.txt --dump_dir result/dump --output_filelist result/output_filelist.txt --visu
Generate final statistics
To get the statistics in the paper, you need to run the following code. It can provide the overall accuracy, mean IOU and mean accuracy.
python eval_iou_acc.py
Results of pytorch implementation
Test in Area_5
| mIOU | macc | ceiling | floor | wall | beam | column | window | door | chair | table | bookcase | sofa | board | clutter | |
|---|---|---|---|---|---|---|---|---|---|---|---|---|---|---|---|
| offical implementation | 41.09 | 48.98 | 88.80 | 97.33 | 69.80 | 0.05 | 3.92 | 46.26 | 10.76 | 52.61 | 58.93 | 40.28 | 5.85 | 26.38 | 33.22 |
| our pytorch implementation | 41.40 | 49.93 | 89.13 | 98.17 | 68.75 | 0.06 | 4.14 | 44.63 | 10.68 | 59.10 | 52.81 | 42.80 | 3.05 | 31.31 | 33.59 |
Six folder validation
| mIOU | macc | ceiling | floor | wall | beam | column | window | door | chair | table | bookcase | sofa | board | clutter | |
|---|---|---|---|---|---|---|---|---|---|---|---|---|---|---|---|
| offical implementation | 47.6 | 66.2 | 88.0 | 88.7 | 69.3 | 42.4 | 23.1 | 47.5 | 51.6 | 42.0 | 54.1 | 38.2 | 9.6 | 29.4 | 35.2 |
| our pytorch implementation |
Meshlab visualization(obj files)