covid19Tracker
The goal of covid19Tracker is to facilitate exploration of Coronavirus disease (COVID-19) dataset. The dataset is provided by JHU CSSE COVID-19 Data and is updated everyday.
The dataset includes new cases, cumulative cases, new deaths and cumulative deaths for each day. It also contains geographical coordinates(Lat,Long) for each country.
This package provides functions to:
- View full dataset in a tidy format
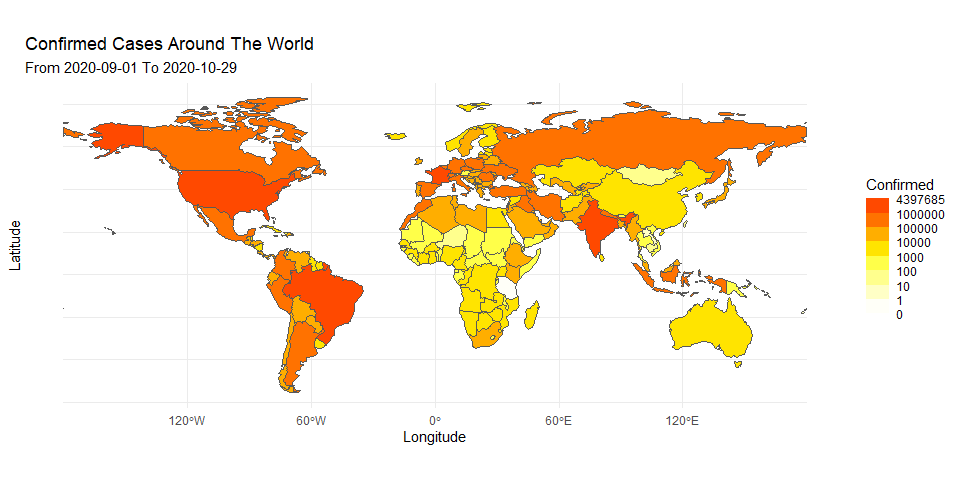
- Plot total cases in a selected period of time on the world map
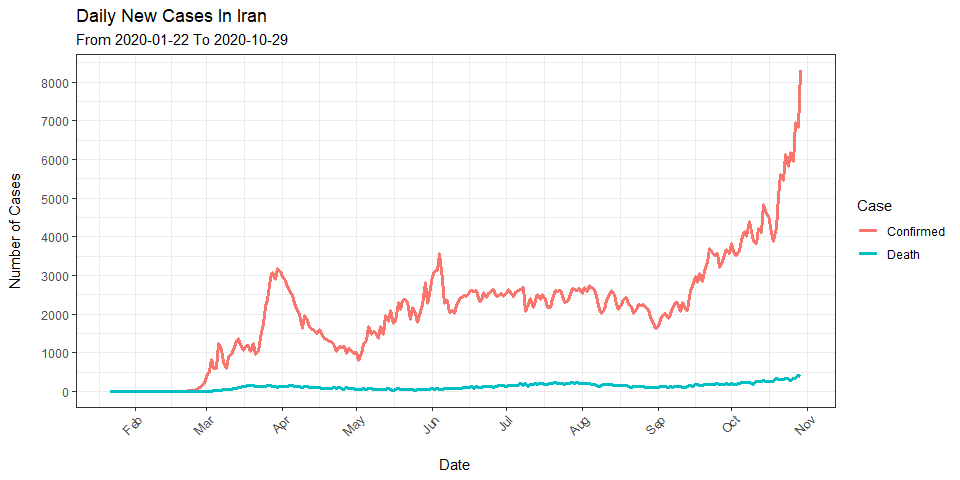
- Plot daily cases of a specific country in a selected period of time
Installation
You can install the development version from
GitHub with:
# install.packages("devtools")
devtools::install_github("PlasterPate/covid19Tracker")
Examples
Getting data
library(covid19Tracker)
dataset <- fetchData()
head(dataset)
#> # A tibble: 6 x 8
#> # Groups:   Region [1]
#>   Region      Date       CumConfirmed Confirmed CumDeath Death   Lat  Long
#>   <chr>       <date>            <dbl>     <dbl>    <dbl> <dbl> <dbl> <dbl>
#> 1 Afghanistan 2020-01-22            0         0        0     0  33.9  67.7
#> 2 Afghanistan 2020-01-23            0         0        0     0  33.9  67.7
#> 3 Afghanistan 2020-01-24            0         0        0     0  33.9  67.7
#> 4 Afghanistan 2020-01-25            0         0        0     0  33.9  67.7
#> 5 Afghanistan 2020-01-26            0         0        0     0  33.9  67.7
#> 6 Afghanistan 2020-01-27            0         0        0     0  33.9  67.7
Visualizing data
plotWorldMap(dateRange = c("2020-09-01", "2020-10-30"), type = "Confirmed")
plotCountryTimeline(dateRange = c("2020-01-01", "2020-12-29"), country = "Iran")