rotein Interface Prediction using Graph Convolutional Networks
Unofficial TensorFlow implementation of Protein Interface Prediction using Graph Convolutional Networks.
Usage
$ unzip dataset.zip
$ python run.py
Dataset
Number of samples
| Set | Complex | Positive | Negative |
|---|---|---|---|
| Training | 140 | 12866 (9.1 %) | 128660 (90.9 %) |
| Validation | 35 | 3138 (0.2 %) | 31380 (99.8 %) |
| Test | 55 | 4871 (0.1 %) | 4953446 (99.9 %) |
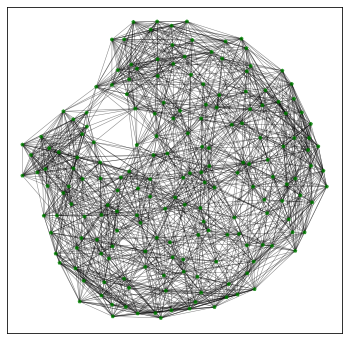
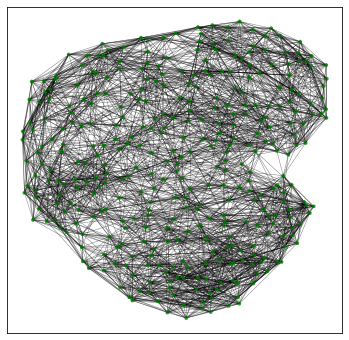
Sample view for Ligand and Receptor respectively.
Feature description
Graph
│
├── Vertex: 70 features
│    ├── Windowed Position Specific Scoring Matrix: 20
│    ├── Relative Accessible Surface Area: 1
│    ├── Residue Depth: 2
│    ├── Protrusion Index: 6
│    ├── Hydrophobicity: 1
│    └── Half Sphere Amino Acid Composition: 40
└── Edge: 2 features
     ├── Average Atomic Distance: 1
     └── CCαO Angle: 1
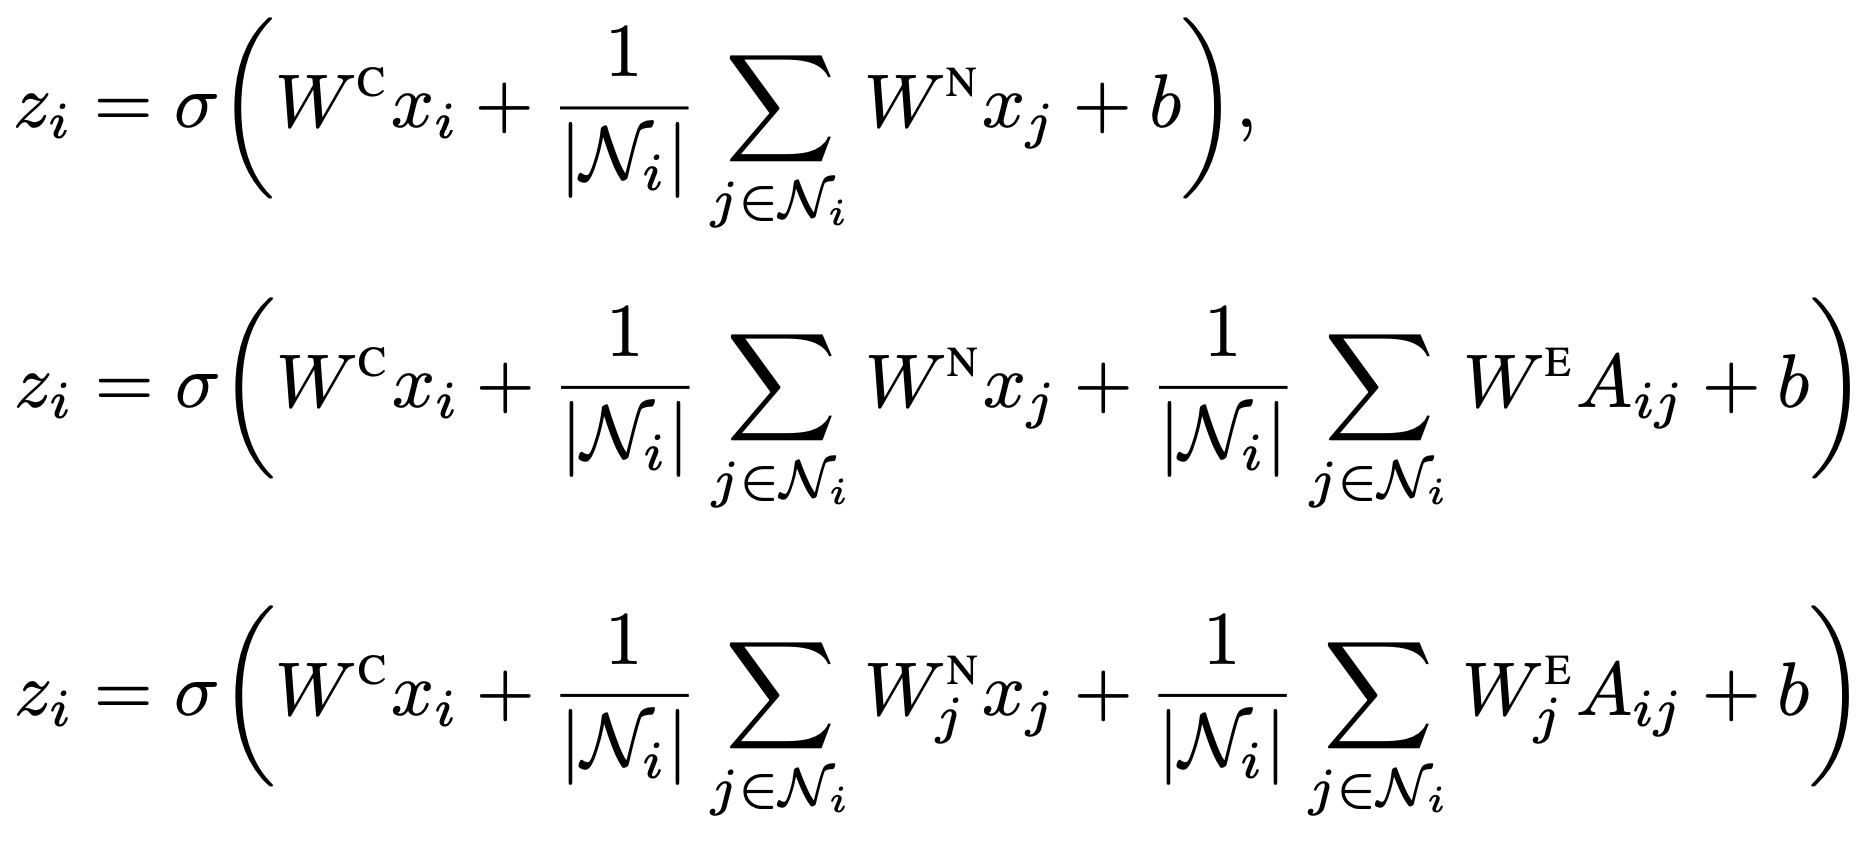
Three equations for each neural network in this repository. Each equation is provided as net00_pipgcn_navg.py, net01_pipgcn_neavg.py, and net02_pipgcn_odepn.py
Result
- Refer that the results shown below are temporary results. (AUROC: 0.81421)
- The model tuning process is not finished completely.

Loss graph.
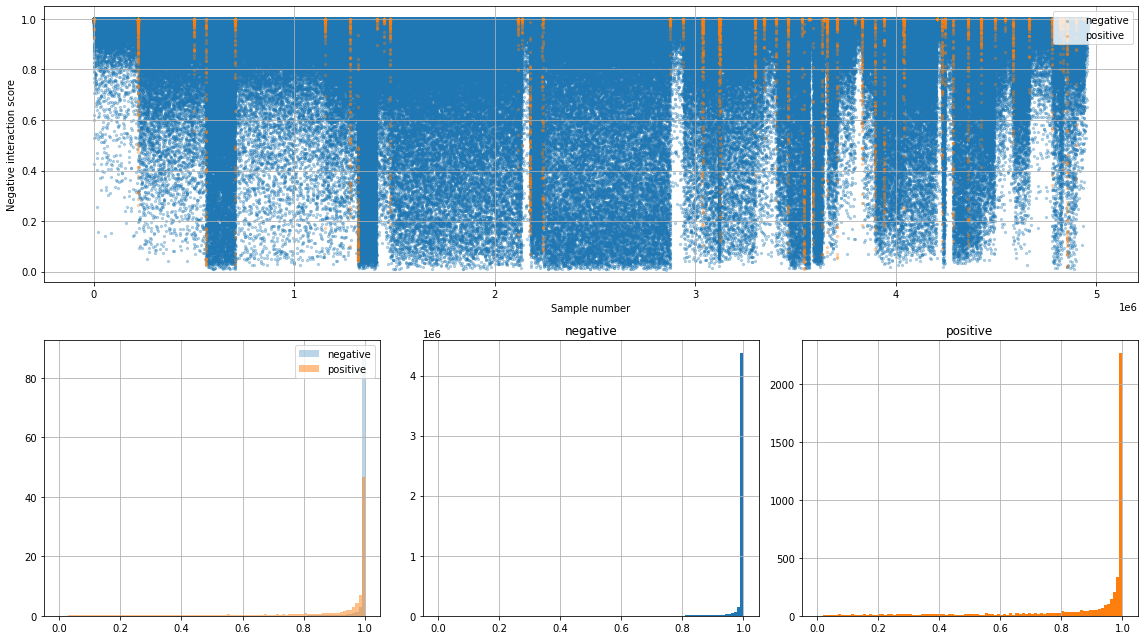
Results of the test process. The first figure (upper side) shows the negative interaction score between ligand and receptor. The lower side figures show a histogram of negative interaction score of negative labeled and positive labeled sample.
Requirements
- TensorFlow 2.3.0
- White Box Layer 0.1.7


