floweaver
Many kinds of data can be thought of as 'flows': energy and materials moving through industry, money flowing through the economy, telephone lines moving between providers, voters moving between parties. floWeaver helps you to exchange and analyse flow data and visualise it using Sankey diagrams.
For example, here is some data on flows of fruit from farms to customers:
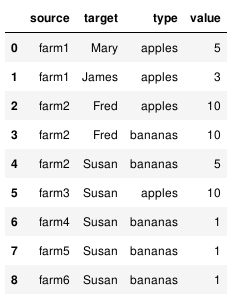
With floWeaver you can visualise this as a variety of Sankey diagrams depending on what you want to show:
Although there are a variety of tools for working with flow data and Sankey diagrams in particular contexts, there are no open data formats for sharing data between tools and domains. We aim to provide a common data format and data converters to support interoperability and open data.


