Weather-Forecasting
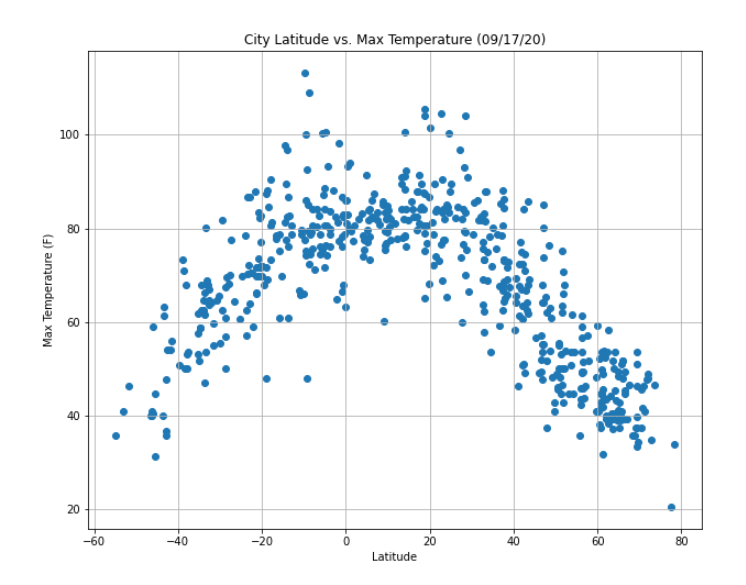
Python scripts were created to visualize the weather for over 500 cities across the world at varying distances from the equator. To understand weather patterns for forecasting, a series of scatter plots were created. The scatter plots depicted the relationship between Temperature versus Latitude, Humidity versus Latitude, Cloudiness versus Latitiude, and Wind Speed versus Latitude. One of the relationship is shown below:
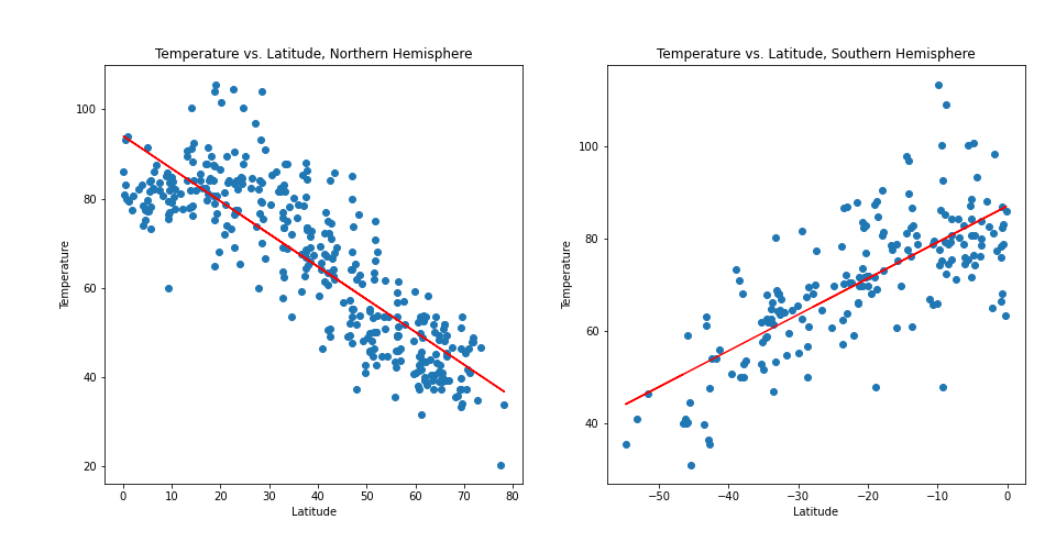
Linear regressions for each relationship were created separating them in Northern and Southern Hemispheres. More than 500 cities were randomly selected based on there latitude and longitude to perform a weather check on each of the cities usig a series of API calls to confirm the findings of the Python scripts. The analysis used external data for comparison using third party APIs. Data was parsed using an OpenWeatherMap and US Census API Keys to make GET requests for JSON formatted information. Requested JSON information was converted into a PYTHON dictionary for loading into a Pandas Dataframe. A Google Maps and Places API Key was used to obtain information about geographic areas. Special attention was taken to understand rate limits and the importance of creating "test cases" prior to running large scripts. A firm understanding of each API documenation was used in the analysis to run efficient Python scripts.
The table below shows 20 of the 550 cities randomly selected for a weather check:
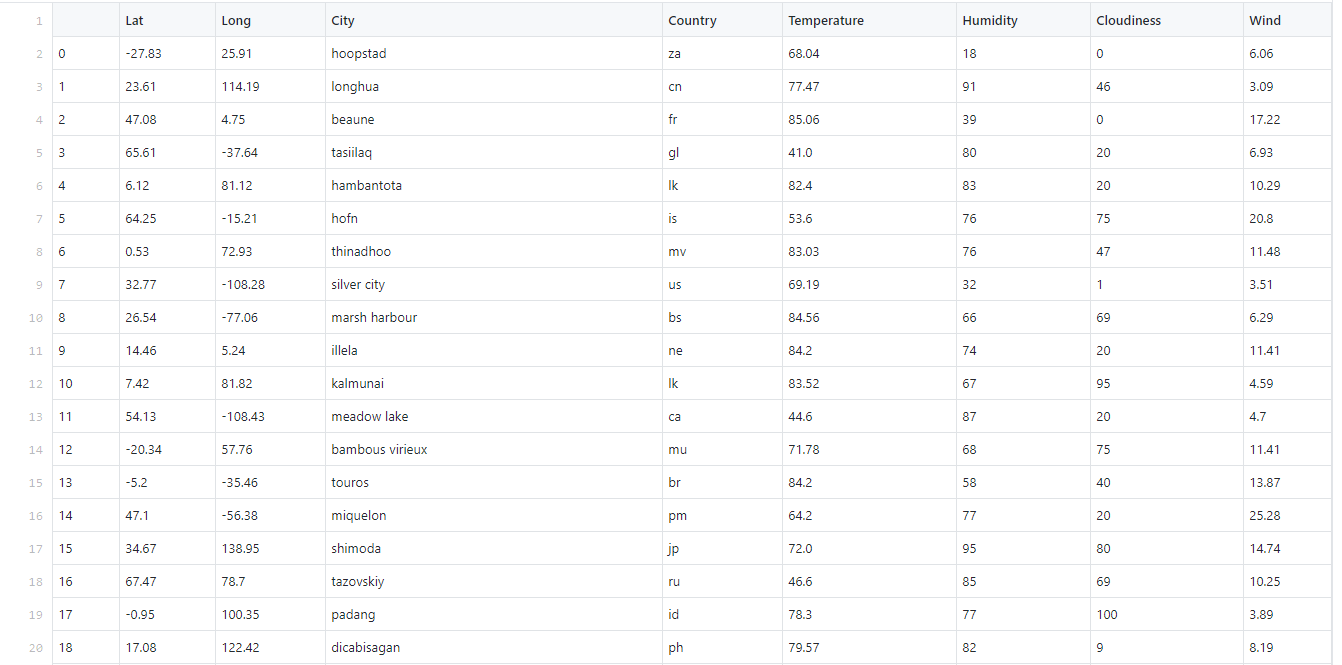
These relationships were used to select ideal weather conditions for vacation planning.
VACATION PLANNING USING WEATHER FORECASTING
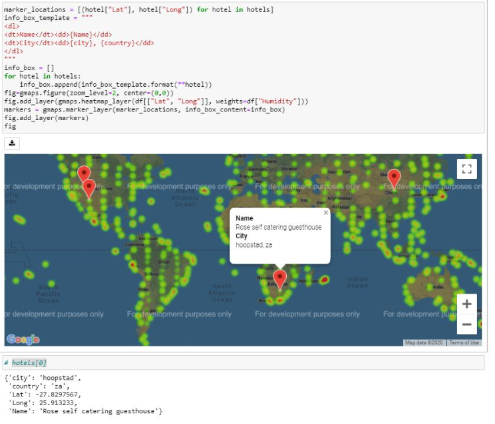
Juptyer-gmaps and Google Places API was used for planning future vacations across the globe.
