Frequency distribution
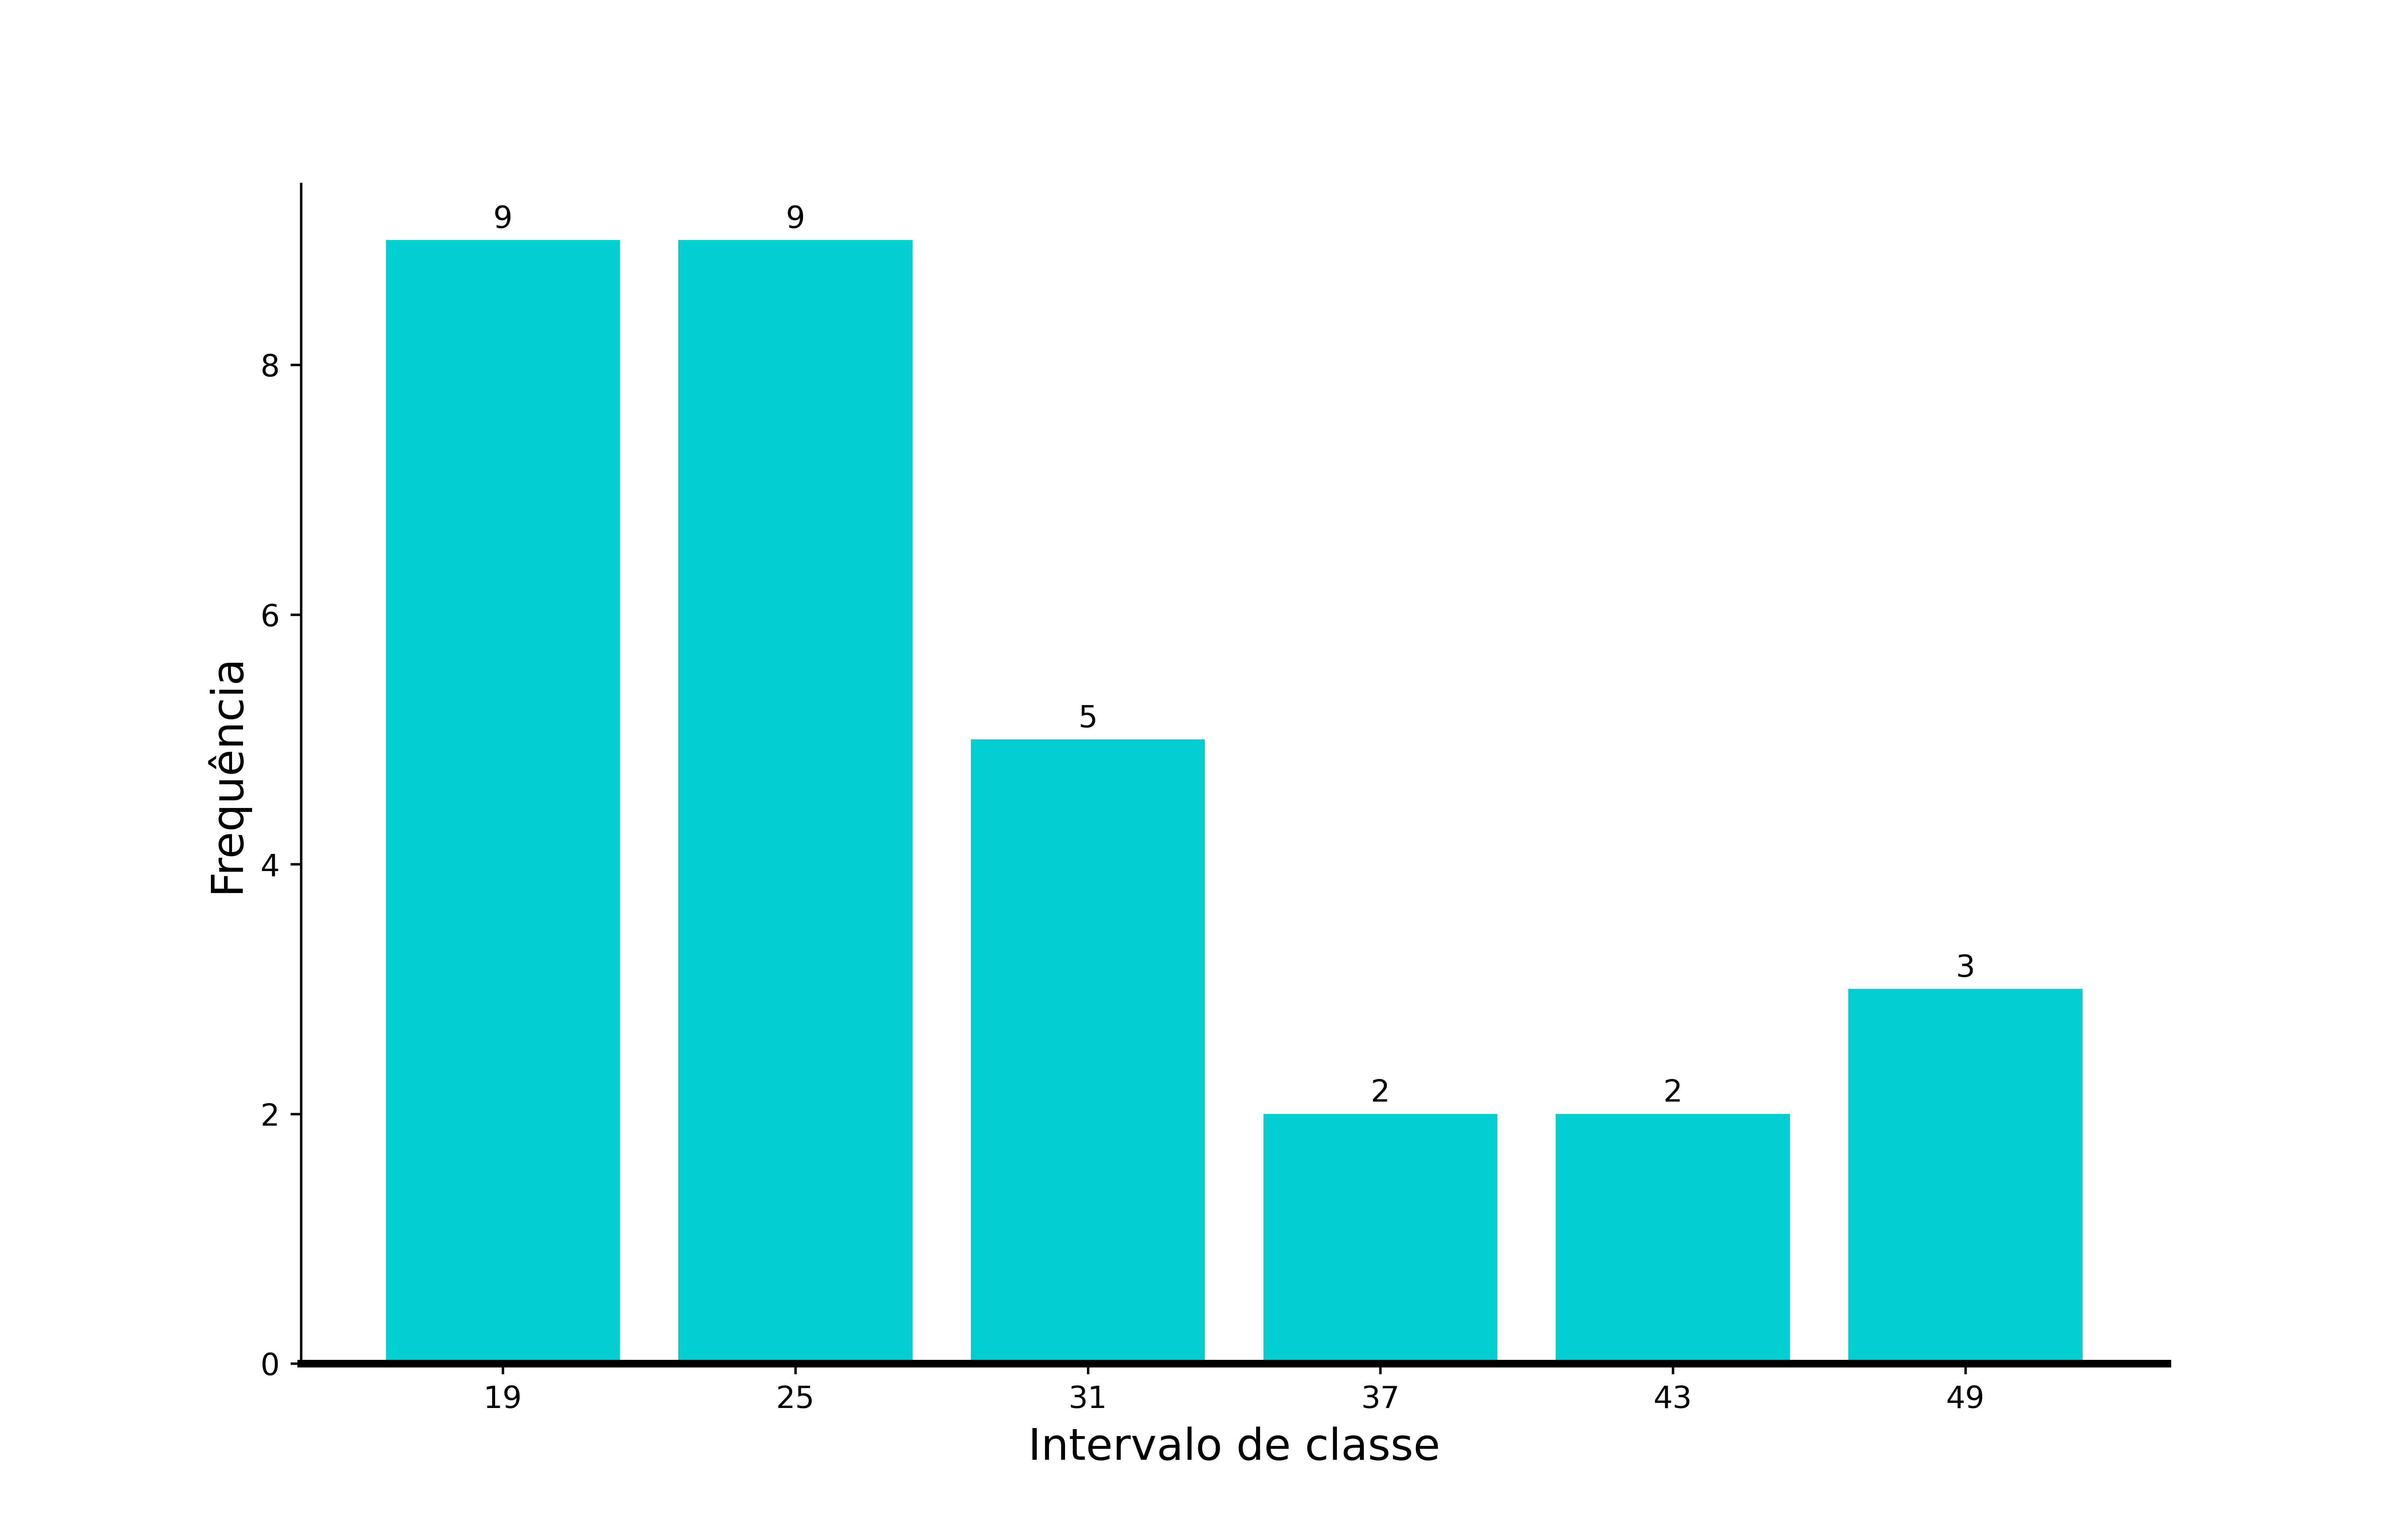
Simple frequency distribution to create frequency table and histogram using matplotlib and pandas.

Installationpip install -r requirements.txt
Hot to use
Put the observed data inside the data.txt file and define the separator that is between the numbers. After placing the data, run the main.py file. Images are placed in the "images" directory
separator = ' '

15 38 14 13 29 25
20 13 16 32 44 39
45 46 19 23 24 18
19 20 21 18 25 33
13 18 22 24 27 27
GitHub - SrBlecaute01/FrequencyDistribution: The simple frequency distribution
The simple frequency distribution. Contribute to SrBlecaute01/FrequencyDistribution development by creating an account on GitHub.
 SrBlecaute01


