tinyGS-antenna-map
This is the antenna performance plotted from tinyGS reception data. See their repository.
The code produces a plot that provides Azimuth and Elevation information showing the location in the sky, based on the observer/station, where the satellite reception is successful and packets are uploaded to TinyGS.
My four active stations show very different reception patterns. These are a 433Mhz vertical 1/4 wave antenna, a 433Mhz vertical dipole, a 433Mhz horizontal dipole, and a 1/4 wave 915 Mhz antenna (that has received nothing useful as there aren't any satellites presently transmitting). All are on the East side of the house and somewhat blocked towards the West.
Darker quadrants mean more reception. Individual packets received are the black dots. Packets received with CRC Errors are shown as red dots.
The center of the circle is exactly vertical from the observer/station. The edge of the circle is the horizon (well, kinda!).
For example, if you operate with a simple horizontal dipole, then you would see a bias in the data towards the higher reception direction (90 degrees from the dipole length). If you have a Al/Ez tracking antenna then you should see a very broad reception map.
The program will display the plot on the desktop if it is run in that environment. If you want a CLI process, then look at the -o flag below. The program uses Matplotlib and the install instructions are included - follow them carefully. All instructions are for Debian (and tested on a R.Pi). This code should work on other systems. Any problems? - please use GitHub issues.
Install
Download and install code from GitHub
The best copy of this code is always on GitHub. If you need the git command (and you will) do this part first:
$ sudo apt-get install -y git
...
$
Grab the code via this:
$ git clone https://github.com/mahtin/tinyGS-antenna-map.git
...
$ cd tinyGS-antenna-map
$
Installing required packages (i.e Matplotlib)
Please read and follow the INSTALL-MATPLOTLIB page. Then return here after that is finished.
Install continued
Once Matplotlib is install cleanly the code requires some additional packages/libraries:
$ sudo python3 -m pip install -U -r requirements.txt
...
$
Now the install is finished. Congratulations.
Setting up your user-id
To plot your own graphs from your own stations, you need to know what your own user-id on TinyGS is. The first option is to save it away in a file for all the code to use.
Storing your user-id
Your user-is can be found via various methods.
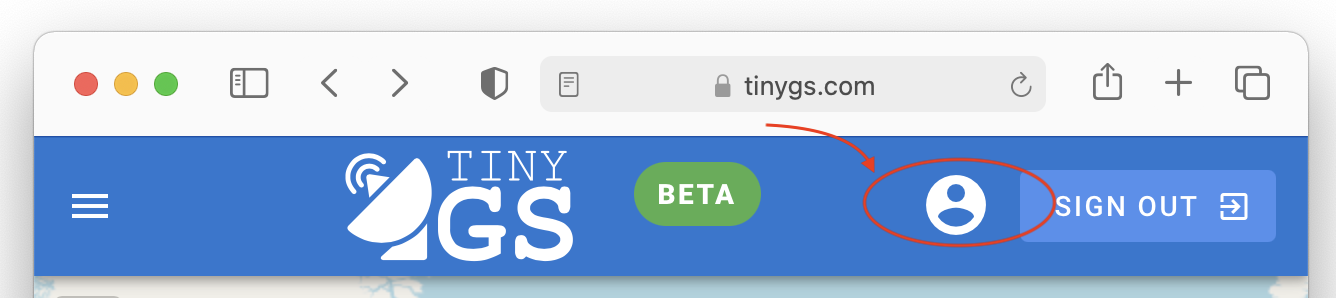
Assuming you are logged into TinyGS, you can visit https://tinygs.com and click on the User Console icon and then look at the resulting station URL (it will be something like: https://tinygs.com/user/20000007). The same user-id number can be seen in the URL for the per-station page.
Or, you can use your Telegram TinyGS Personal Bot channel to find your user-id. It's the last number from the passwordless login link you get with the /weblogin command.
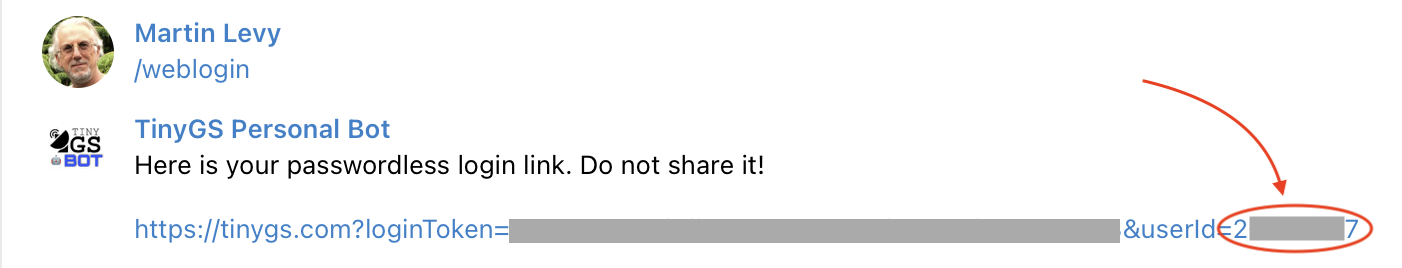
The user-id is the URL provided (see example image).
Copy the number seens and use it to create a .user_id file via the following command:
$ echo '20000007' > .user_id
$
Your number will be different.
Specifying user for each run
If you choose, you specify your user-id manually on each command run. See the -u option below.
Plotting your antenna map
All your stations will be plotted on a single page. Make the displayed page larger if you need.
$ ./tinygs_antenna_map.py
This assumes that you are on a machine with a display. If you are headless, then the following will be useful:
$ ./tinygs_antenna_map.py -o > pretty-graph.png
$ scp pretty-graph.png somewhere-else.example.com:
If Matplotlib sends out warning messages about Connection Refused or Gdk-CRITICAL, it's because you can't connect to the display (even if you are trying to write an image file). This still produces an image. You can fix this by setting the MPLBACKEND environment variable (see Matplotlib builtin backends instructions):
$ MPLBACKEND=Agg ./tinygs_antenna_map.py -o > pretty-graph.png
...
$
tinygs_antenna_map.py options
The tinygs_antenna_map.py program takes various arguments.
tinygs_antenna_map [-v|--verbose] [-h|--help] [-r|--refresh] [-s|--station[,station...]] [-u|--user] user-id]
- [-v|--verbose] - provide some information on each of the packets being processed/displayed.
- [-h|--help] - this message.
- [-r|--refresh] - presently unused; but will pull data from TinyGS site on demand.
- [-s|--station[,station...]] - list the station or stations to plot. Use comma-seperated (i.e. A,B,C) for more than one station.
- [-u|--user] user-id] - define the user-id vs using the
.user_idfile. - [-o|--output] - produce a PNG file on stdout (use:
tinygs_antenna_map.py -o > diagram.pngfor example`).
Specifying the station or user-id
To produce a plot for a specific user (for example 20000007):
$ ./tinygs_antenna_map.py -u 20000007
Your number will be different.
To produce a plot for one of your specific stations, use the station name:
$ ./tinygs_antenna_map.py -s W6LHI_433Mhz
To produce a plot for someone else station (and I'm not judging you in anyway):
$ ./tinygs_antenna_map.py -s MALAONE -u 0
(No idea who MALAONE is). Note the -u 0 argument. This overtides your .user_id file if it exists (as this station is a different user).
Data refresh
The program can be run many times; however it will only collect new data from TinyGS API no-and-again. This is to reduce the load on their servers.
- Packet data is updated at-best every twelve hours
- Station data is updated at-best every five days
- TLE data is updated at-best every two days
Should you want to force a data refresh, then use the -r flag. Don't blame me if you get banned from the site.
$ ./tinygs_antenna_map.py -r
I don't recommend using that flag.
Adding antenna direction graphics to the plot(s)
If you want to superimpose an antenna direction on the graphs; use the following examples:
An simple antenna direction for all ploted stations:
$ ./tinygs_antenna_map.py -a 220
An antenna direction for a specific ploted station:
$ ./tinygs_antenna_map.py -a 35@W6LHI_433Mhz
An antenna direction for more than one ploted station:
$ ./tinygs_antenna_map.py -a 35@W6LHI_433Mhz,110@W6LHI_433Mhz_2
The numbers are in degress and the comma seperated list must contain valid station names.


