Py3Plex
Heterogeneous networks are complex networks with additional information assigned to nodes or edges (or both). This library includes some of the state-of-the-art algorithms for decomposition, visualization and analysis of such networks.
Getting Started
To get started, please view examples folder. Extensive documentation is available at: docs
Prerequisites
- Networkx (2.1)
- Numpy (0.8)
- Scipy (1.1.0)
- RDFlib (for ontology-based tasks) (any)
- Cython (>0.28)
Installing
To install, simply:
python3 setup.py install
or you can try:
pip3 install py3plex
For any errors, please open an issue!
Contributions
If you are interested in contributing please:
- Either open a pull request
- Or write with your idea
- Or open an issue with your suggestion (feature requests welcome)
Tests
To test whether the core library functionality works well, you can run the test suite from the ./tests folder as:
python3 -m pytest test_core_functionality.py
Example uses and tutorials
Currently, there are more than 20 different uses, showcasing Py3plex's functionality; all accessible in the examples/ folder!
First steps
A network can be loaded by either using one of the many available parsers (below), or constructed using our functional API. Examples of loading the network:
(See example files in the examples/ folder!)
First, simple edgelists:
n1 n2
n3 n1
...
multilayer_network = multinet.multi_layer_network().load_network("../datasets/test.edgelist",directed=False, input_type="edgelist")
Adding the layers and the weights, a single edge looks like (node layer node layer weight):
n1 l1 n2 l2 0.4
n1 l3 n3 l1 1
multilayer_network = multinet.multi_layer_network().load_network("../datasets/multiedgelist.txt",directed=False, input_type="multiedgelist")
Other handy parsers include:
from py3plex.core import multinet

## sparse .mat (matlab-like) matrix -- numpy sparse matrix
multilayer_network = multinet.multi_layer_network().load_network("../datasets/ions.mat",directed=False, input_type="sparse")

## GML
multilayer_network = multinet.multi_layer_network().load_network("../datasets/ecommerce_0.gml",directed=True, input_type="gml")

## internal gpickle format
multilayer_network = multinet.multi_layer_network().load_network("../datasets/epigenetics.gpickle",directed=True, input_type="gpickle_biomine")
A common use is, to parse a given network from a file, and construct a multilayer network object on the fly, as discussed next.
Network construction and manipulation
This minimal example offers an intuitive API for multilayer(plex) network construction.
## this example demonstrates how a network can be manipulated

from py3plex.core import multinet
from py3plex.core import random_generators

## An example general multilayer network
A = multinet.multi_layer_network()

## add a single node with type
simple_node = {"source" : "node1","type":"t1"}
A.add_nodes(simple_node)
A.monitor("Printing a single node.")
print(list(A.get_nodes(data=True)))

## add a single edge with type
simple_edge = {"source":"node1",
               "target":"node2",
               "type":"mention",
               "source_type":"t1",
               "weight" : 2, ## add arbitrary attributes!
               "target_type":"t2"}

A.add_edges(simple_edge)
A.monitor("Printing a single edge.")
print(list(A.get_edges(data=True)))

## multiple edges are added by simply packing existing edges into a list.
simple_attributed_edges = [{"source":"node1","target":"node6","type":"mention","source_type":"t1","target_type":"t5"},{"source":"node3","target":"node2","type":"mention","source_type":"t1","target_type":"t3"}]
A.add_edges(simple_attributed_edges)
A.monitor("Printing multiple edges")
print(list(A.get_edges(data=True)))

## Edges can also be added as lists: [n1,l1,n2,l2,w]
example_list_edge = [["node3","t2","node2","t6",1],["node3","t2","node2","t6",1]]

## specify that input is list, all else is recognized by Py3plex!
A.add_edges(example_list_edge,input_type="list")
print(list(A.get_edges()))
Random network generation is as simple as they come..
A.monitor("Random ER multilayer graph in progress")
ER_multilayer = random_generators.random_multilayer_ER(300,6,0.05,directed=False)
ER_multilayer.visualize_network(show=True)

## dealing with multiplex networks
B = multinet.multi_layer_network(network_type="multiplex")
B.add_edges([[1,1,2,1,1],[1,2,3,2,1],[1,2,3,1,1],[2,1,3,2,1]],input_type="list")
Aggregating edges is now simple:
import networkx as nx
from py3plex.core import multinet
from py3plex.core import random_generators

## initiate an instance of a random graph
ER_multilayer = random_generators.random_multilayer_ER(500,8,0.05,directed=False)

## simple networkx object
aggregated_network = ER_multilayer.aggregate_edges(metric="count",normalize_by="degree")
print(nx.info(aggregated_network))

## unnormalized counts for edge weights
aggregated_network = ER_multilayer.aggregate_edges(metric="count",normalize_by="raw")
print(nx.info(aggregated_network))
Network indexing is now simple (multiple levels supported!)
C = B.subnetwork([2],subset_by="layers")
print(list(C.get_nodes()))

C = B.subnetwork([2],subset_by="node_names")
print(list(C.get_nodes()))

C = B.subnetwork([(1,1),(1,2)],subset_by="node_layer_names")
print(list(C.get_nodes()))
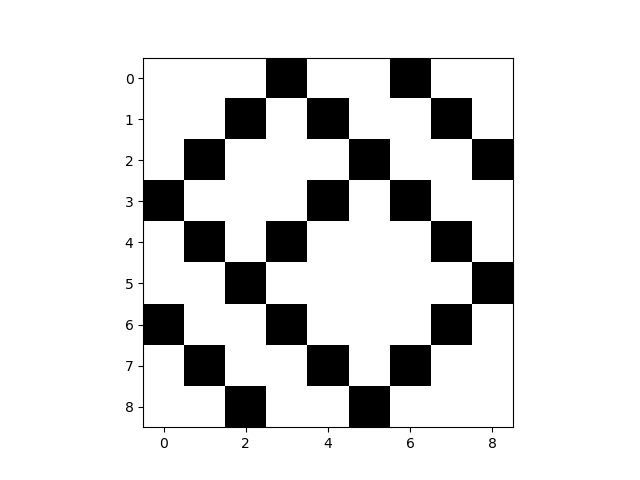
Getting the multiplex supra adjacency is simple!
During initiation, if you specify the network type to be 'multiplex', node couplings are added.
from py3plex.core import multinet
from py3plex.core import random_generators

comNet = multinet.multi_layer_network(network_type="multiplex",coupling_weight=1).load_network('../datasets/simple_multiplex.edgelist',directed=False,input_type='multiplex_edges')
comNet.basic_stats()
comNet.load_layer_name_mapping('../datasets/simple_multiplex.txt')
mat = comNet.get_supra_adjacency_matrix()
print(mat.shape)
kwargs = {"display":True}
comNet.visualize_matrix(kwargs)
## how are nodes ordered?
for edge in comNet.get_edges(data=True):
    print(edge)
print (comNet.node_order_in_matrix)
One of the simplest ways is list-based construction.., where
[1,1,2,2,1] cooresponds to node 1 on layer 1 connects with node 2 on layer 2, where the edge is weighted as 1. Note that node and layer names are not limited to integers, an example edge might also look like
["person1","facebook","person2","twitter",2]
## dealing with multiplex networks
B = multinet.multi_layer_network(network_type="multiplex")
B.add_edges([[1,1,2,1,1],[1,2,3,2,1],[1,2,3,1,1],[2,1,3,2,1]],input_type="list")

## coupled edges
B.monitor(list(B.get_edges(multiplex_edges=True)))

## non-coupled edges
B.monitor(list(B.get_edges(multiplex_edges=False)))

## visualize this toy example
B.visualize_network(show=True)
Py3plex also offers some random graph generators.
A.monitor("Random ER multilayer graph in progress")
ER_multilayer = random_generators.random_multilayer_ER(300,6,0.05,directed=False)
ER_multilayer.visualize_network(show=True)
For more examples, please inspect the ./examples folder. For any questions, feature requests and similar, hesitate not to contact me!
Examples
Here are some showcase examples! (run from the ./examples folder!)
Some simple statistics
from py3plex.core import multinet
from py3plex.algorithms.statistics.basic_statistics import *

multilayer_network = multinet.multi_layer_network().load_network("../datasets/imdb_gml.gml",directed=True,input_type="gml")

stats_frame = core_network_statistics(multilayer_network.core_network)
print(stats_frame)

top_n_by_degree = identify_n_hubs(multilayer_network.core_network,20)
print(top_n_by_degree)
Network decomposition
What is network decomposition? Does your network consist of multiple node types? Are there directed edges present? If so, information from the whole network can be used to construct artificial edges between the nodes of a user-defined type (defined using node triplets). This way, a heterogeneous network can be simplified to a homogeneous one, useful for e.g., machine learning tasks!
from py3plex.core import multinet
from py3plex.algorithms.node_ranking import sparse_page_rank, stochastic_normalization_hin
from py3plex.algorithms.benchmark_classification import *

dataset = "../datasets/labeled_epigenetics.gpickle"

multilayer_network = multinet.multi_layer_network().load_network(input_file=dataset,directed=True,input_type=dataset.split(".")[-1])

print ("Running optimization for {}".format(dataset))
multilayer_network.basic_stats() ## check core imports
triplet_set = list(set(multilayer_network.get_decomposition_cycles()))
print(triplet_set)
for decomposition in multilayer_network.get_decomposition(heuristic=["idf","rf"], cycle=triplet_set, parallel=True):
    print(decomposition)
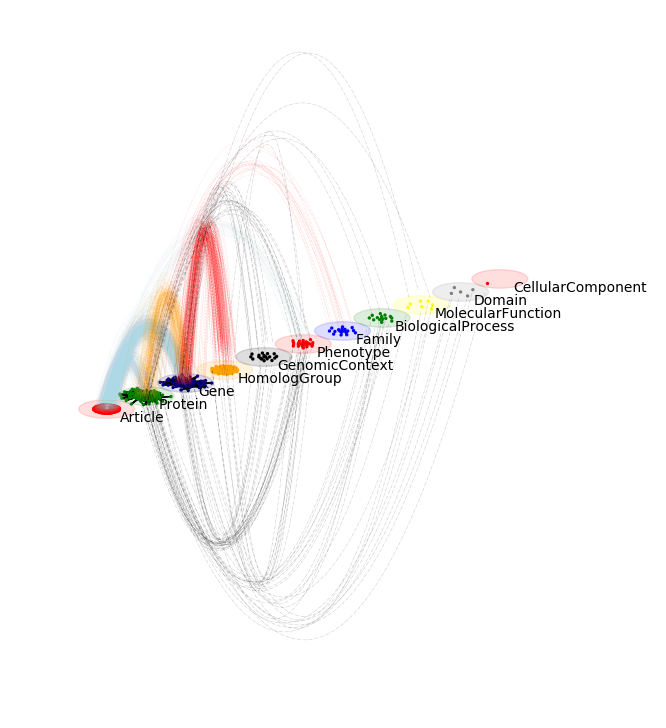
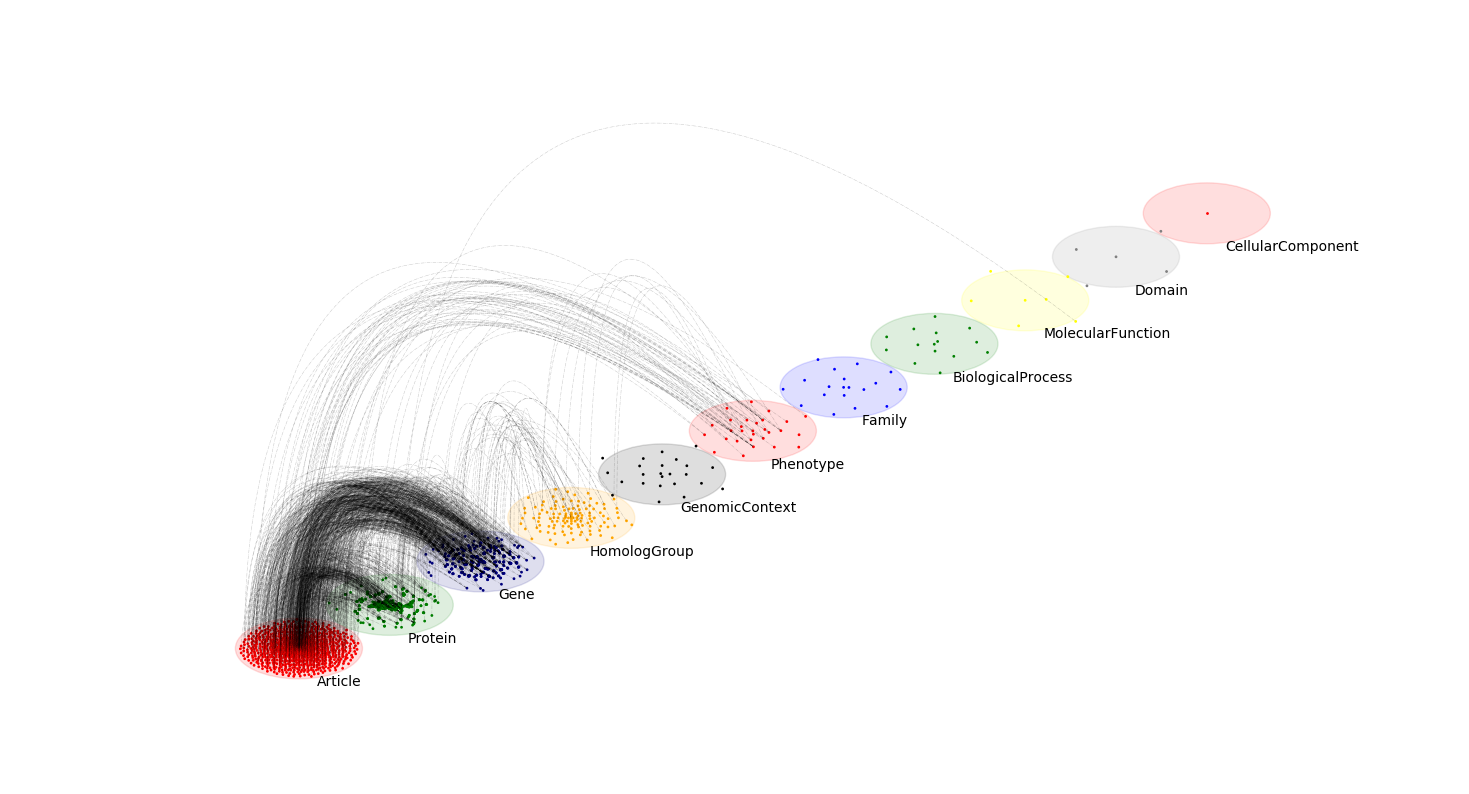
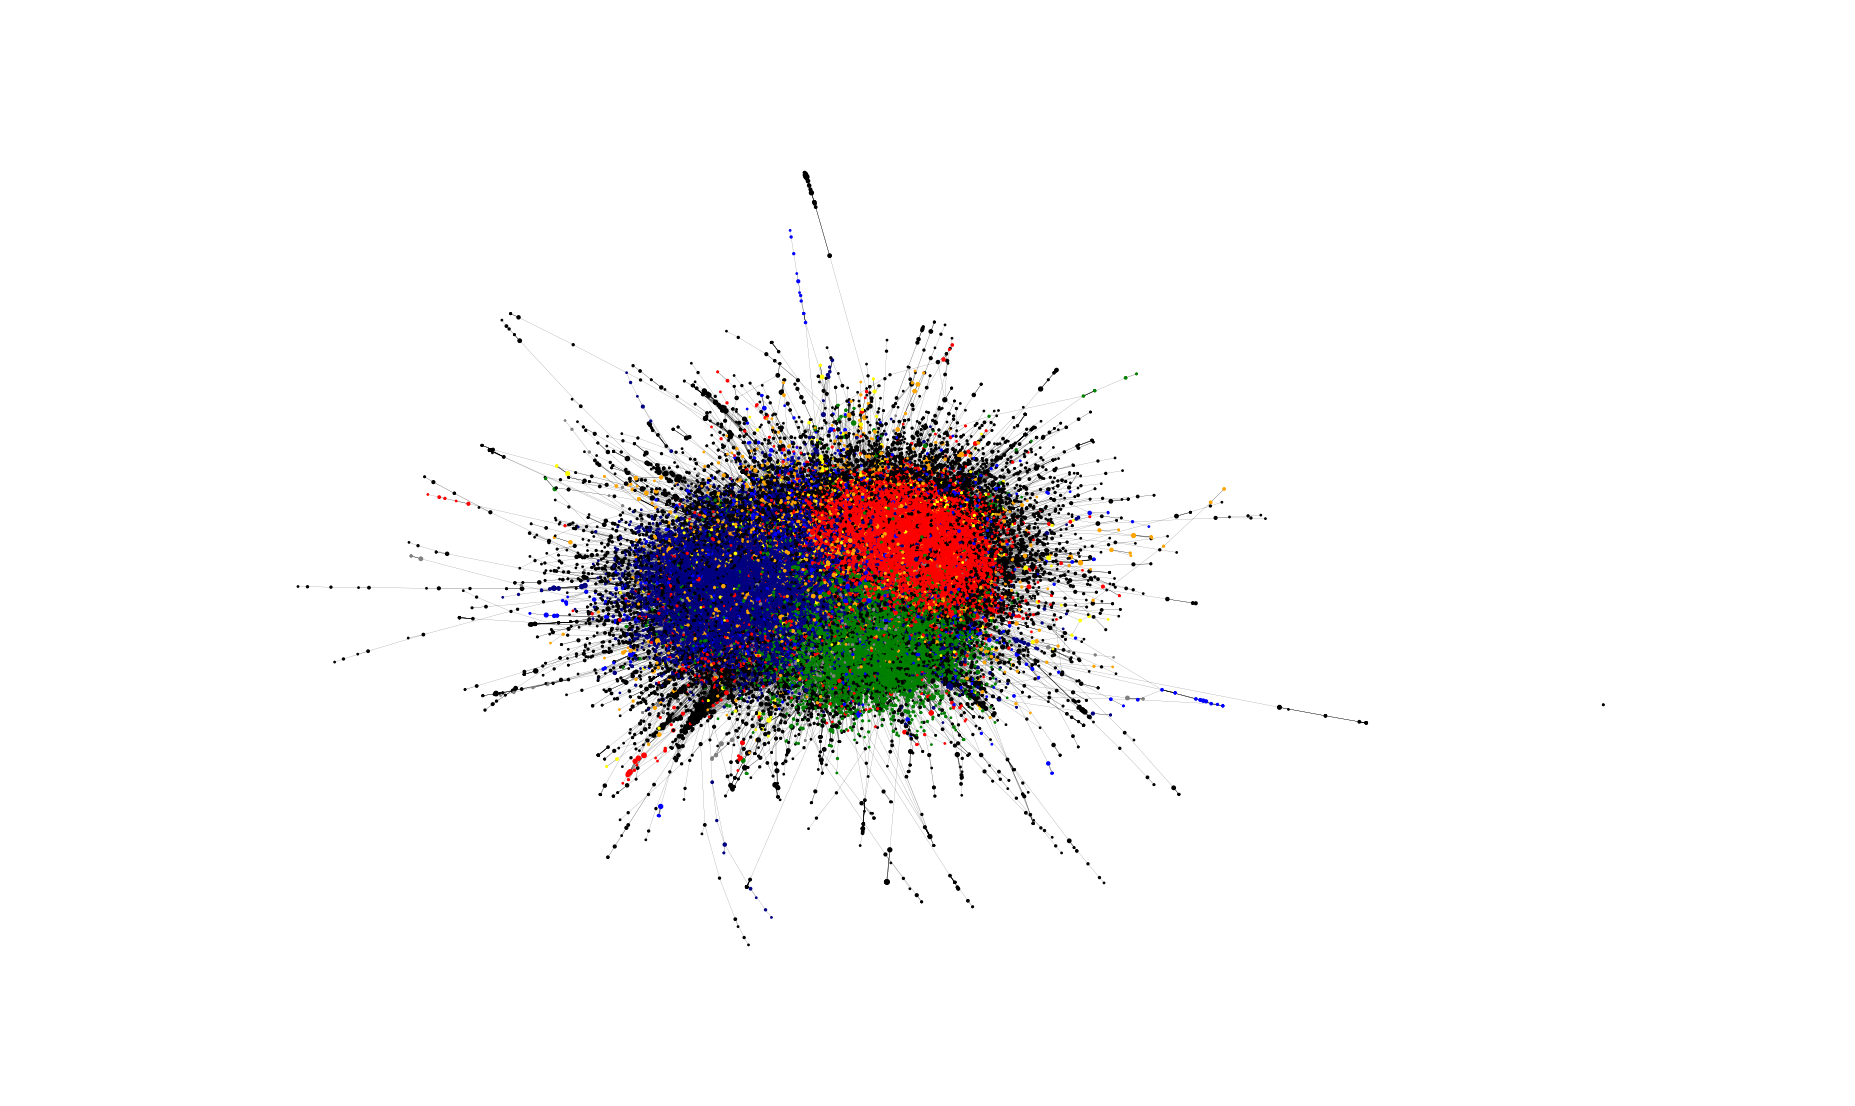
Multilayer visualization
from py3plex.visualization.multilayer import *
from py3plex.visualization.colors import all_color_names,colors_default
from py3plex.core import multinet

## you can try the default visualization options --- this is the simplest option/

## multilayer
multilayer_network = multinet.multi_layer_network().load_network("../datasets/goslim_mirna.gpickle",directed=False, input_type="gpickle_biomine")
multilayer_network.basic_stats() ## check core imports

multilayer_network.visualize_network(style="diagonal")
plt.show()

multilayer_network.visualize_network(style="hairball")
plt.show()
For fine-tuning, plots can be constructed using functional API:
## individual visualization elements can be accessed, and customized as follows
network_labels, graphs, multilinks = multilayer_network.get_layers() ## get layers for visualization
#print(network_labels,graphs)
draw_multilayer_default(graphs,display=False,background_shape="circle",labels=network_labels)

enum = 1
color_mappings = {idx : col for idx, col in enumerate(colors_default)}
for edge_type,edges in multilinks.items():
    draw_multiedges(graphs,edges,alphachannel=0.2,linepoints="-.",linecolor=color_mappings[enum],curve_height=5,linmod="upper",linewidth=0.4)
    enum+=1
plt.show()

### basic string layout
multilayer_network = multinet.multi_layer_network().load_network("../datasets/imdb_gml.gml",directed=False,label_delimiter="---")
network_colors, graph = multilayer_network.get_layers(style="hairball")
hairball_plot(graph,network_colors)
plt.show()
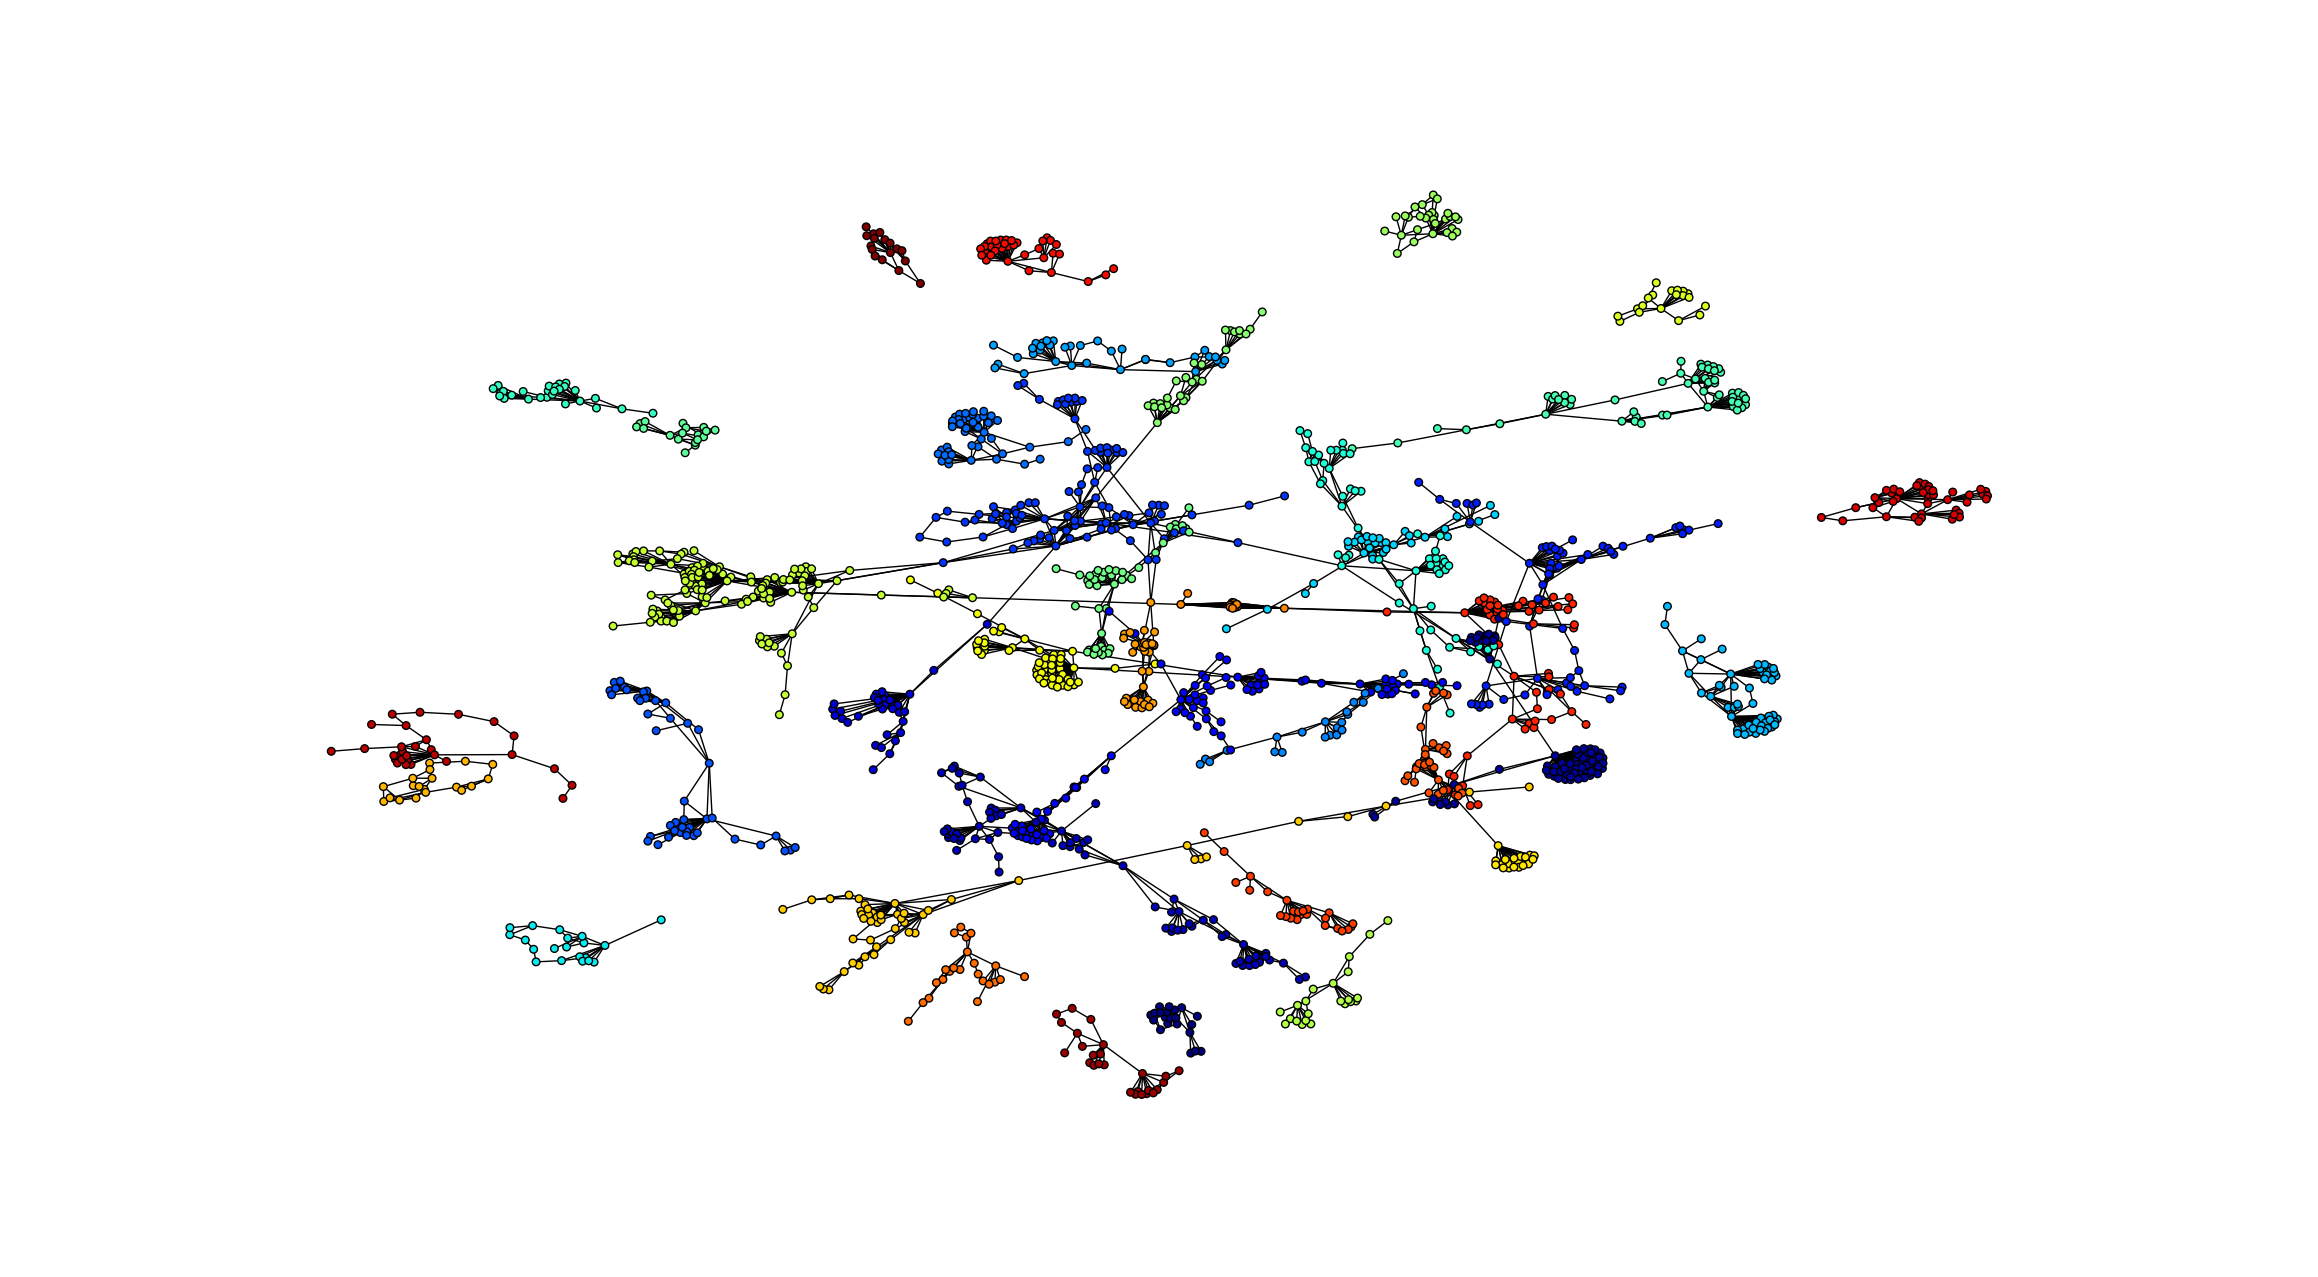
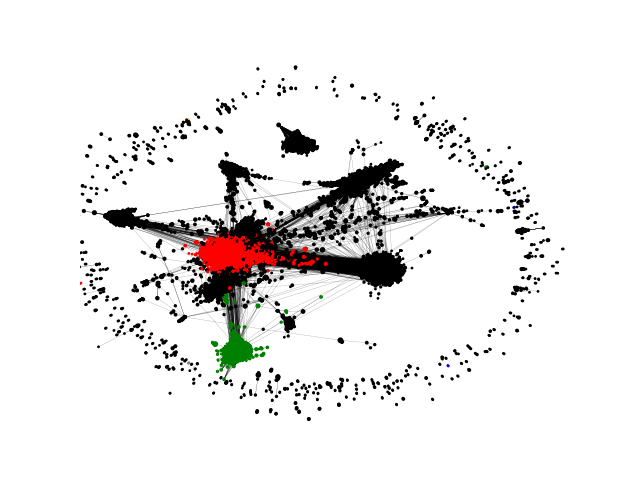
Network community visualization
Communities are relevant for exploring network-function association, as well as higher order organization in networks.
from py3plex.algorithms.community_detection import community_wrapper as cw
from py3plex.core import multinet
from py3plex.visualization.multilayer import *
from py3plex.visualization.colors import colors_default
from collections import Counter

import argparse

parser = argparse.ArgumentParser()
parser.add_argument("--input_network",default="../datasets/cora.mat")
parser.add_argument("--input_type",default="sparse")
args = parser.parse_args()

network = multinet.multi_layer_network().load_network(input_file=args.input_network,directed=False,input_type=args.input_type) ## network and group objects must be present within the .mat object

network.basic_stats() ## check core imports

partition = cw.louvain_communities(network.core_network)

## select top n communities by size
top_n = 10
partition_counts = dict(Counter(partition.values()))
top_n_communities = list(partition_counts.keys())[0:top_n]

## assign node colors
color_mappings = dict(zip(top_n_communities,colors_default[0:top_n]))

network_colors = [color_mappings[partition[x]] if partition[x] in top_n_communities else "black" for x in network.get_nodes()]

## visualize the network's communities!
hairball_plot(network.core_network,color_list = network_colors,layered=False,layout_parameters={"iterations" : 50},scale_by_size=True,layout_algorithm="force",legend=False)
plt.show()
Or if run as
python3 example_community_detection.py --input_network ~/Downloads/soc-Epinions1.txt.gz --input_type edgelist
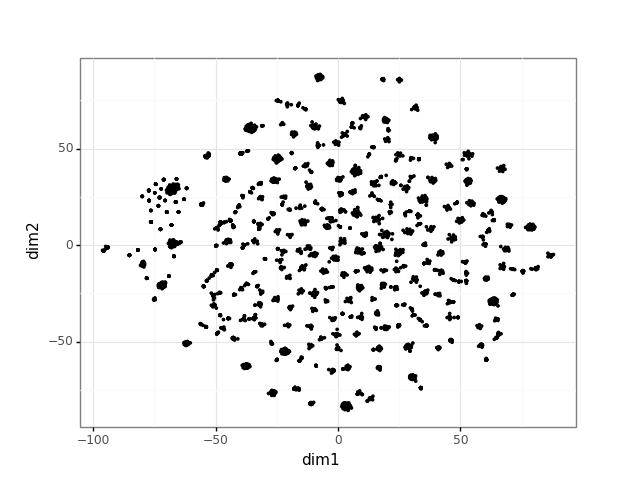
Network Embedding visualization
Recent improvements in network analysis commonly rely on network embeddings. This library offers wrappers for embedding construction and visualization.
from py3plex.core import multinet
from py3plex.wrappers import train_node2vec_embedding
from py3plex.visualization import embedding_visualization
import json

## load network in GML
multilayer_network = multinet.multi_layer_network().load_network("../datasets/imdb_gml.gml",directed=True,input_type="gml")

## save this network as edgelist for node2vec
multilayer_network.save_network("../datasets/test.edgelist")

## call a specific embedding binary --- this is not limited to n2v
train_node2vec_embedding.call_node2vec_binary("../datasets/test.edgelist","../datasets/test_embedding.emb",binary="../bin/node2vec",weighted=False)

## preprocess and check embedding
multilayer_network.load_embedding("../datasets/test_embedding.emb")

## visualize embedding
embedding_visualization.visualize_embedding(multilayer_network)

## output embedded coordinates as JSON
output_json = embedding_visualization.get_2d_coordinates_tsne(multilayer_network,output_format="json")

with open('../datasets/embedding_coordinates.json', 'w') as outfile:
    json.dump(output_json, outfile)
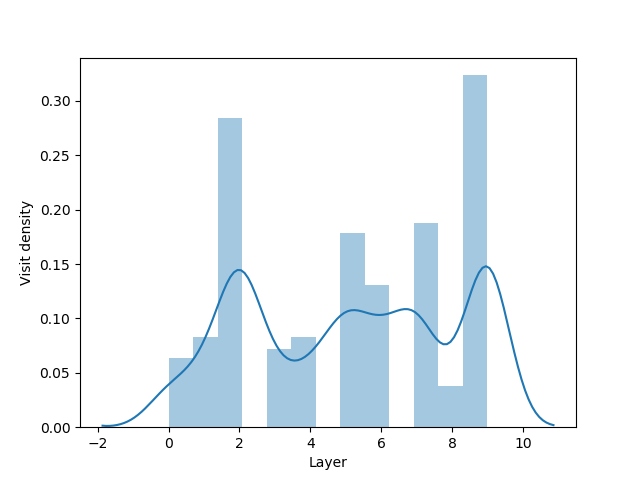
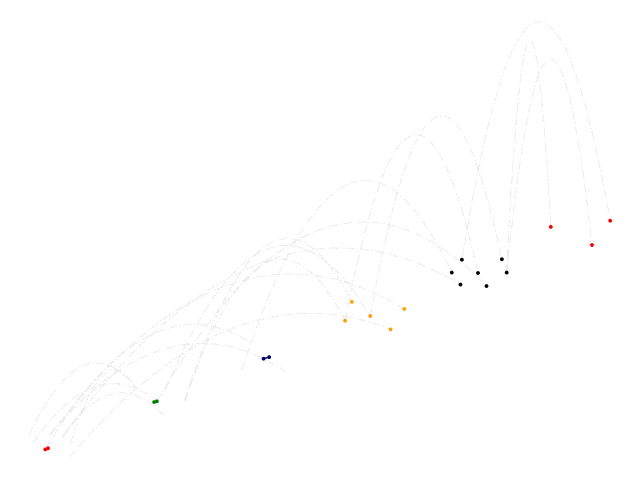
Simple spreading
Simple spreading for a single origin point.
## simple spreading process on multilayers

## simple spreading process on multilayers

from py3plex.core import multinet
from py3plex.core import random_generators
import numpy as np
import queue
import matplotlib.pyplot as plt
import seaborn as sns

## some random graph
ER_multilayer = random_generators.random_multilayer_ER(3000,10,0.05,directed=False)

## seed node
all_nodes = list(ER_multilayer.get_nodes())
all_nodes_indexed = {x:en for en,x in enumerate(all_nodes)}

## spread from a random node
random_init = np.random.randint(len(all_nodes))
random_node = all_nodes[random_init]
spread_vector = np.zeros(len(ER_multilayer.core_network))
Q = queue.Queue(maxsize=3000)
Q.put(random_node)

layer_visit_sequence = []
node_visit_sequence = []
iterations = 0
while True:
    if not Q.empty():
        candidate = Q.get()
        iterations+=1
        if iterations % 100 == 0:
            print("Iterations: {}".format(iterations))
        for neighbor in ER_multilayer.get_neighbors(candidate[0],candidate[1]):
            idx = all_nodes_indexed[neighbor]
            if spread_vector[idx] != 1:
                layer_visit_sequence.append(candidate[1])
                node_visit_sequence.append((neighbor,iterations))
                Q.put(neighbor)
                spread_vector[idx] = 1
    else:
        break

sns.distplot(layer_visit_sequence)
plt.xlabel("Layer")
plt.ylabel("Visit density")
plt.show()
Animation Example
One can easily animate multiple plots (examples/example_animation.py)
Acknowledgements
ForceAtlas2 cython implementation is based on the one provided at https://github.com/bhargavchippada/forceatlas2, developed by Bhargav Chippada. The code is included by the author's permission. We also thank Thomas Aynaud for the permission to include the initial version of the Louvain algorithm.
Citation
@InProceedings{10.1007/978-3-030-05411-3_60,
author="{\v{S}}krlj, Bla{\v{z}}
and Kralj, Jan
and Lavra{\v{c}}, Nada",
editor="Aiello, Luca Maria
and Cherifi, Chantal
and Cherifi, Hocine
and Lambiotte, Renaud
and Li{\'o}, Pietro
and Rocha, Luis M.",
title="Py3plex: A Library for Scalable Multilayer Network Analysis and Visualization",
booktitle="Complex Networks and Their Applications VII",
year="2019",
publisher="Springer International Publishing",
address="Cham",
pages="757--768",
abstract="Real-life systems are commonly represented as networks of interacting entities. While homogeneous networks consist of nodes of a single node type, multilayer networks are characterized by multiple types of nodes or edges, all present in the same system. Analysis and visualization of such networks represent a challenge for real-life complex network applications. The presented Py3plex Python-based library facilitates the exploration and visualization of multilayer networks. The library includes a diagonal projection-based network visualization, developed specifically for large networks with multiple node (and edge) types. The library also includes state-of-the-art methods for network decomposition and statistical analysis. The Py3plex functionality is showcased on real-world multilayer networks from the domains of biology and on synthetic networks.",
isbn="978-3-030-05411-3"
}


