termgraph.py
A python command-line tool which draws basic graphs in the terminal.
Graph types supported:
- Bar Graphs
- Color charts
- Multi-variable
- Stacked charts
- Horizontal or Vertical
- Emoji!
Examples
termgraph.py data/ex1.dat

# Reading data from data/ex1.dat

2007: ▇▇▇▇▇▇▇▇▇▇▇▇▇▇▇▇▇ 183.32
2008: ▇▇▇▇▇▇▇▇▇▇▇▇▇▇▇▇▇▇▇▇▇▇ 231.23
2009: ▇ 16.43
2010: ▇▇▇▇ 50.21
2011: ▇▇▇▇▇▇▇▇▇▇▇▇▇▇▇▇▇▇▇▇▇▇▇▇▇▇▇▇▇▇▇▇▇▇▇▇▇▇▇▇▇▇▇▇▇▇▇▇▇▇ 508.97
2012: ▇▇▇▇▇▇▇▇▇▇▇▇▇▇▇▇▇▇▇▇ 212.05
2014: ▏ 1.00
An example using emoji as custom tick:
termgraph.py data/ex1.dat --custom-tick "?" --width 20 --title "Running Data"

# Running Data

2007: ??????? 183.32
2008: ????????? 231.23
2009:  16.43
2010: ? 50.21
2011: ???????????????????? 508.97
2012: ???????? 212.05
2014:  1.00
An example using stdin and emoji:
echo "Label,3,9,1" | termgraph.py --custom-tick "?" --no-title --no-label


??? 3.00
????????? 9.00
? 1.00
Most results can be copied and pasted wherever you like, since they use standard block characters. However the color charts will not show, since they use terminal escape codes for color. A couple images to show color examples:
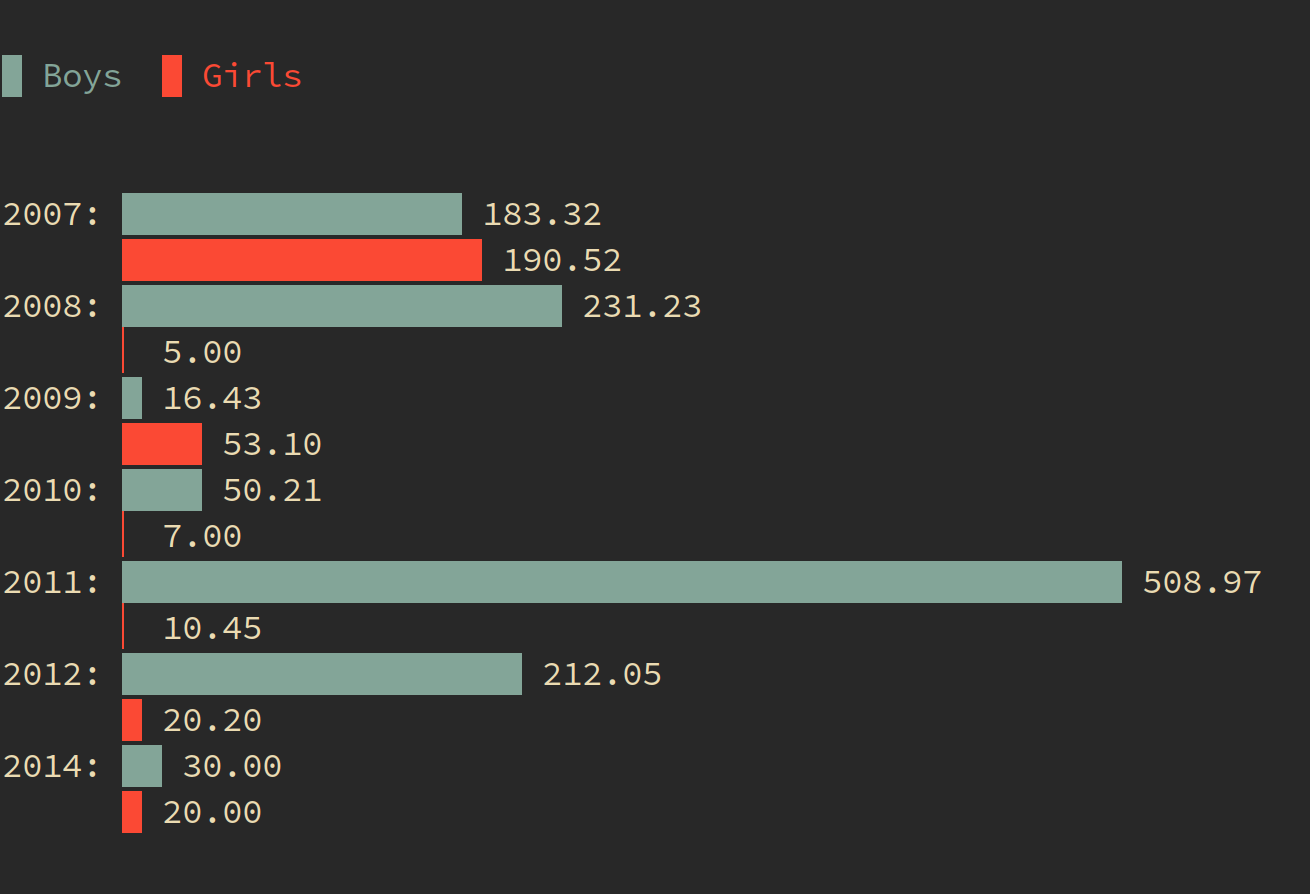
termgraph.py data/ex4.dat --color {blue,red} --no-title
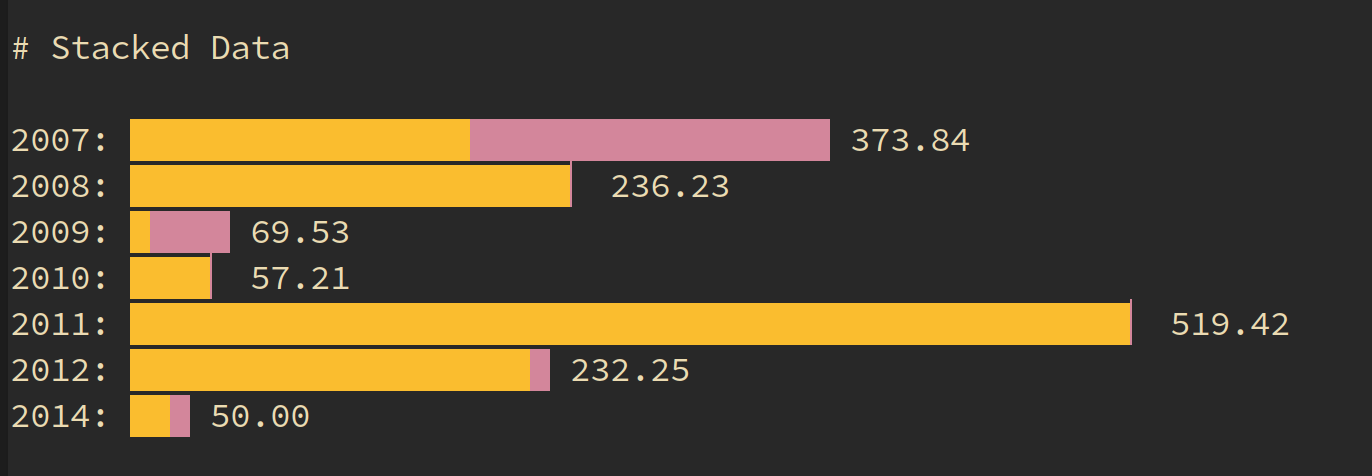
termgraph.py data/ex7.dat --color {yellow,magenta} --stacked --title "Stacked Data"
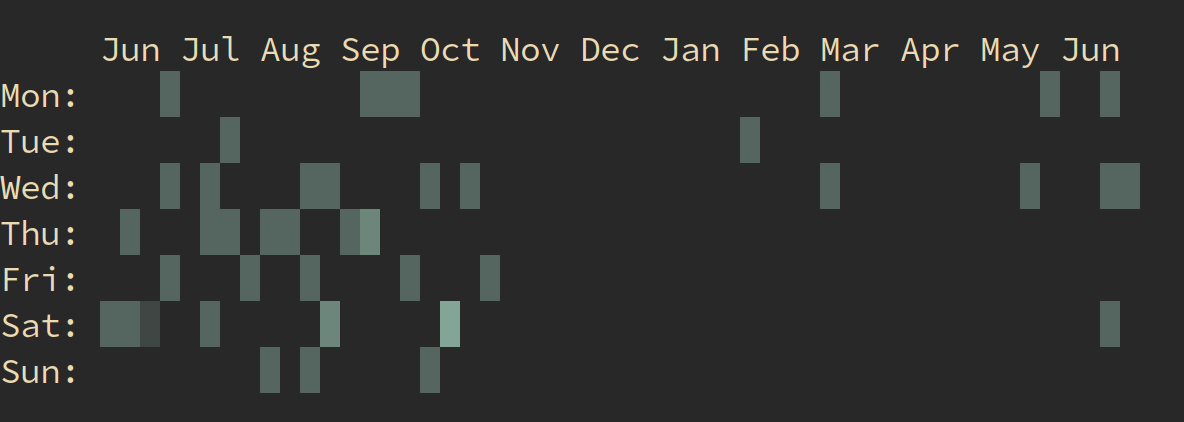
Calendar Heatmap, expects first column to be date in yyyy-mm-dd
termgraph.py --calendar --start-dt 2017-07-01 data/cal.dat
Install
- Works best with python3
- pip3 install colorama
- Download script, set executable and put in path
Usage
-
Create data file with two columns either comma or space separated.
The first column is your labels, the second column is a numeric data -
termgraph.py [datafile]
-
Help: termgraph.py -h
usage: termgraph.py [-h] [--title TITLE] [--width WIDTH] [--format FORMAT]
                    [--suffix SUFFIX] [--no-labels]
                    [--color [{red,blue,green,magenta,yellow,black,cyan} [{red,blue,green,magenta,yellow,black,cyan} ...]]]
                    [--vertical] [--stacked] [--different-scale] [--calendar]
                    [--start-dt START_DT] [--custom-tick CUSTOM_TICK]
                    [--delim DELIM] [--verbose]
                    [filename]

draw basic graphs on terminal

positional arguments:
  filename              data file name (comma or space separated). Defaults to
                        stdin.

optional arguments:
  -h, --help            show this help message and exit
  --title TITLE         Title of graph
  --width WIDTH         width of graph in characters default:50
  --format FORMAT       format specifier to use.
  --suffix SUFFIX       string to add as a suffix to all data points.
  --no-labels           Do not print the label column
  --color [{red,blue,green,magenta,yellow,black,cyan} [{red,blue,green,magenta,yellow,black,cyan} ...]]
                        Graph bar color( s )
  --vertical            Vertical graph
  --stacked             Stacked bar graph
  --different-scale     Categories have different scales.
  --calendar            Calendar Heatmap chart
  --start-dt START_DT   Start date for Calendar chart
  --custom-tick CUSTOM_TICK
                        Custom tick mark, emoji approved
  --delim DELIM         Custom delimiter, default , or space
  --verbose             Verbose output, helpful for debugging


