Flexitext
Flexitext is a Python library that makes it easier to draw text with multiple styles in Matplotlib. This library is inspired and influenced by the R package ggtext.
Installation
Flexitext requires a working Python interpreter (3.6+). This library can be installed using pip:
pip install flexitext
Alternatively, you can install the development version from GitHub:
pip install git+https://github.com/tomicapretto/flexitext.git
Dependencies
Flexitext only requires Matplotlib version 3.4 or higher.
Introduction
Flexitext does not use HTML, CSS, or Markdown to specify text styles. It implements a tag based styling very similar to HTML tags. A styled text consists of an opening tag that defines the styles to apply, the text block, and a closing tag. For example:
"<color:blue, size:16>This is blue text</>"
<color:blue, size:16> is the opening tag, with styles separated by a comma, This is blue text is the text to be drawn, and </> is the closing tag.
Examples
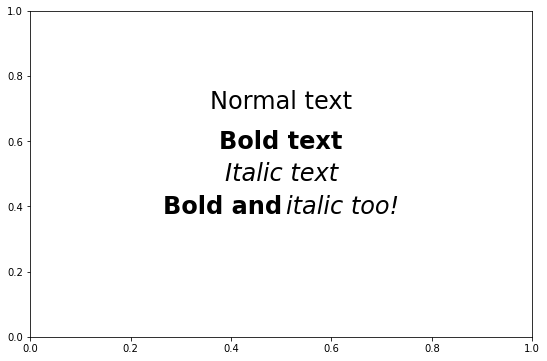
The easiest way to use flexitext is through the flexitext function.
import matplotlib as mpl
import matplotlib.pyplot as plt

from flexitext import flexitext

mpl.rcParams['figure.facecolor'] = 'w'
fig, ax = plt.subplots(figsize=(9, 6))

text = "Normal text"
ax.text(0.5, 0.7, text, size=24, ha="center")

text = "<weight:bold, size:24>Bold text</>"
flexitext(0.5, 0.6, text, ha="center")

text = "<style:italic, size:24>Italic text</>"
flexitext(0.5, 0.5, text, ha="center")

text = "<weight:bold, size:24>Bold and</> <style:italic, size:24>italic too!</>"
flexitext(0.5, 0.4, text, ha="center");
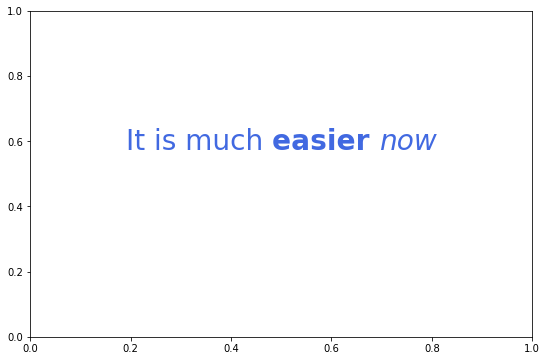
Styles can be nested
fig, ax = plt.subplots(figsize=(9, 6))

text = "<size:28, color:royalblue>It is much <weight:bold>easier </><style:italic>now</></>"
flexitext(0.5, 0.6, text, ha="center");
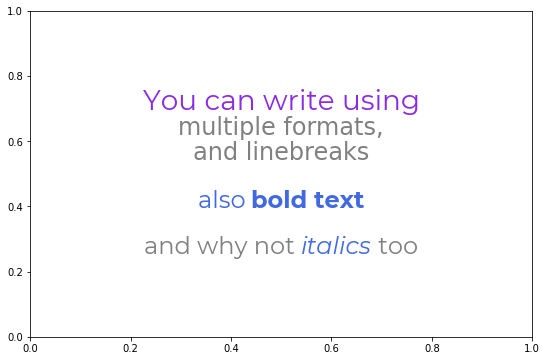
A more convoluted example:
text = (
    "<size:28, color:blueviolet, name:Montserrat>You can write using\n</>"
    + "<color:grey, size:24>multiple formats,\nand linebreaks\n\n"
    + "<color:royalblue, name:Montserrat>also <weight:bold>bold text\n\n</></>"
    + "<name:Montserrat>and why not <color:royalblue, style:italic>italics</> too</></>"
)

fig, ax = plt.subplots(figsize=(9, 6))
flexitext(0.5, 0.5, text, ha="center", ma="center");
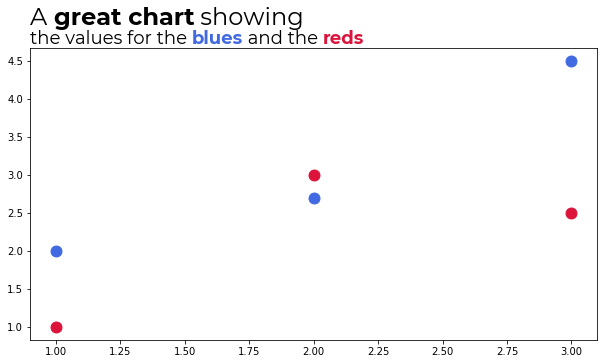
Use the figure fraction coordinates to write a formatted title.
fig, ax = plt.subplots(figsize=(9, 6))
fig.subplots_adjust(top=0.8, left=0.025)

x = [1, 2, 3]
y_blue = [2, 2.7, 4.5]
y_red = [1, 3, 2.5]


ax.scatter(x, y_blue, color="royalblue", s=120)
ax.scatter(x, y_red, color="crimson", s=120)

# Add flexitext
text = (
    "<name:Montserrat><size:24>A <weight:bold>great chart</> showing</>\n"
    + "<size:18>the values for the "
    + "<color:royalblue, weight:bold>blues</> and the <color:crimson, weight:bold>reds</></></>"
)
flexitext(0.025, 0.8, text, va="bottom", xycoords="figure fraction");
Notes
Flexitext only supports the following styles
- alpha
- backgroundcolor
- color
- family
- name
- size
- style
- weight
See Matplotlib's documentation for more information about their meaning and available values.
Flexitext logo is created with Flexitext and Matplotlib (see here).
 tomicapretto


