Spotify User Analytics
Containerized end-to-end analytics of Spotify data using Python, dbt, Postgres, and Metabase.
In this project, we will be analyzing our listening history, top tracks & artists, and genres from Spotify. Here are the tools that we will be using:
- Python - Scraping data from Spotify API endpoints and saving files to CSV
- Postgres - Our database wherein data will be stored into and queried from
- dbt (Data Build Tool) - Data modeling tool to transform our data in staging to fact, dimension tables, and views
- Metabase - Dashboarding tool to analyze our data
- Docker - Containerizing our applications i.e. Postgres, dbt, and Metabase
Project Files
- app
- main.py - Our main ETL script that fetches data from the Spotify API endpoints and saves them to CSV
- util.py - Utility helper file that contains a custom class SpotifyUtil
- config_template.py - This is where we will store our credentials
- dbt
- models - Contains the sql scripts and schema.yml files that will be used when we run our transformations
- dbt_entrypoint.sh - Script that will server as our entrypoint when running the
dbtcontainer - Dockerfile - Contains the commands to create the custom Docker image
- dbt_project.yml - YAML file to configure dbt
- packages.yml - YAML file for test dependencies
- profiles.yml - YAML file to configure connection of
dbttopostgres
- metabase
- metabase.db - Metadata database of Metabase for the dashboard
- docker-compose.yml - YAML file to orchestrate Docker containers composition
Workflow
The diagram below illustrates the systems design and how the workflow will go.
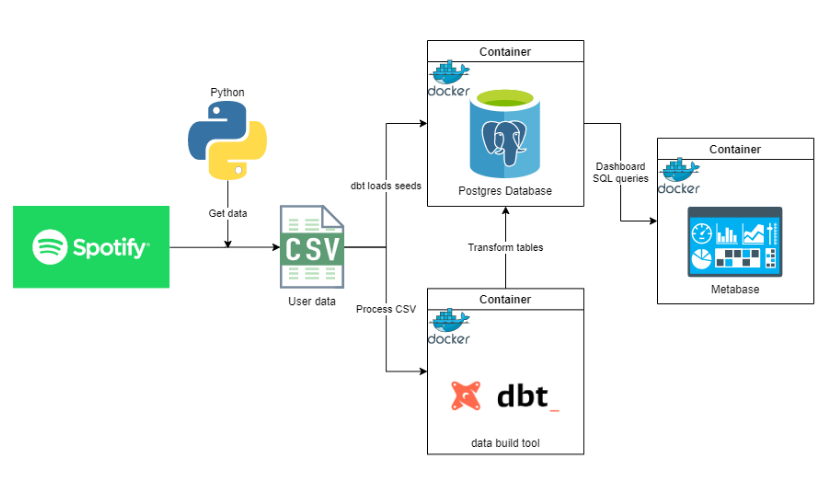
Let's break this down into major steps
- Setup
- Get Spotify data
- Build Docker containers
- Transform, model, and load data to Postgres DB using dbt
- Serve to Metabase dashboard
Setup
-
cdto this directory -
Open a terminal, create a Python virtual environment using:
Windows
> python -m venv venv

Mac/Linux
$ make build
then activate it by executing
Windows:
> venv\Scripts\activate.bat
(For Windows) Install dependencies using:
> python -m pip install -r requirements.txt -
While dependencies are being installed, navigate to Spotify Developer Page and login
-
Create an app and note down the
Client IDandClient Secret, make sure to add a redirect uri inSettingsi.e.http://localhost:8888/callback/ -
Fill the details in config_template.py and rename it to
config.py
Get Spotify data
-
Run the main Python script to fetch the data from Spotify using:
Windows > python app\main.py Mac/Linux $ make run -
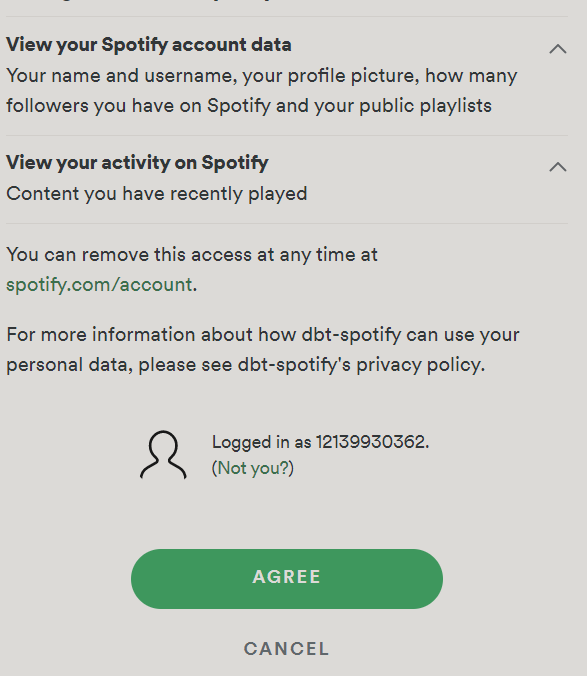
While the script is running, it will redirect to a webpage that looks like the one below, and just click
AGREE
p.s. follow [me](https://open.spotify.com/user/12139930362) for nice tunes! ?
Build Docker containers
Now that we have the CSV files in the data folder, we can now build our Docker containers using this command:
docker-compose up
This command will build our dbt, postgres, and metabase containers. This will also run our data loading, transformations, and modeling in the background.
Transform, model, and load data to Postgres DB using dbt
During docker-compose, dbt runs the following commands
dbt init spotify_analytics: Creates the project folderdbt debug: Checks the connection with the Postgres databasedbt deps: Installs the test dependenciesdbt seed: Loads the CSV files into staging tables in the database inpostgresdbt run: Runs the transformations and loads the data into the databasedbt docs generate: Generates the documentation of the dbt projectdbt docs serve: Serves the documentation on a webserver
Navigating to http://localhost:8080 to see the documentation, we can see the lineage graph, a DAG (Directed Acyclic Graph).
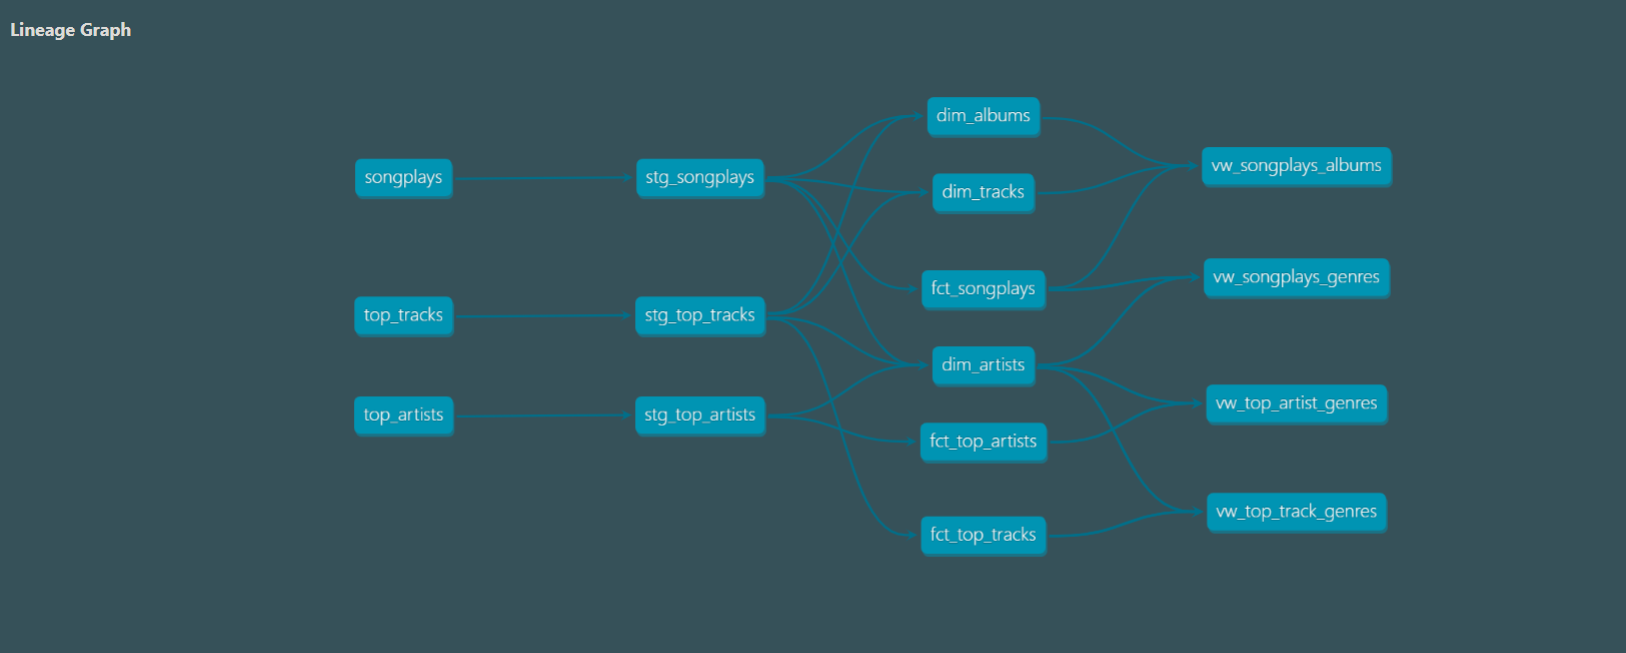
This shows us how the CSV files have been transformed to the fact, dimension tables and views.
Serve to Metabase dashboard
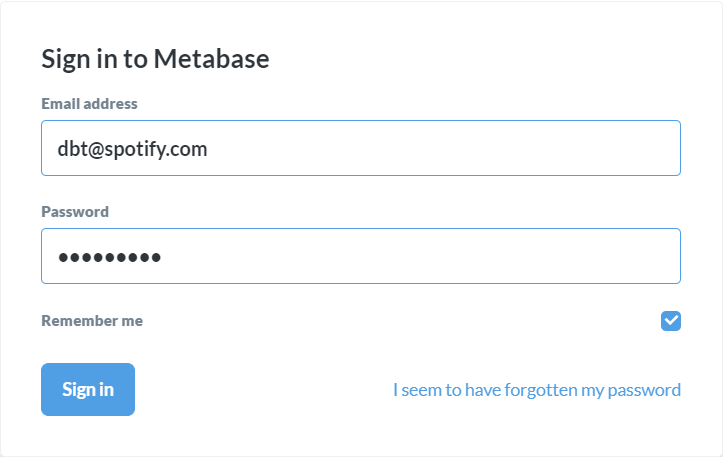
Now that the data is loaded and transformed in our database, we may now view it in http://localhost:3000.
You may need to login, the credentials are
email: [email protected]
password: password1
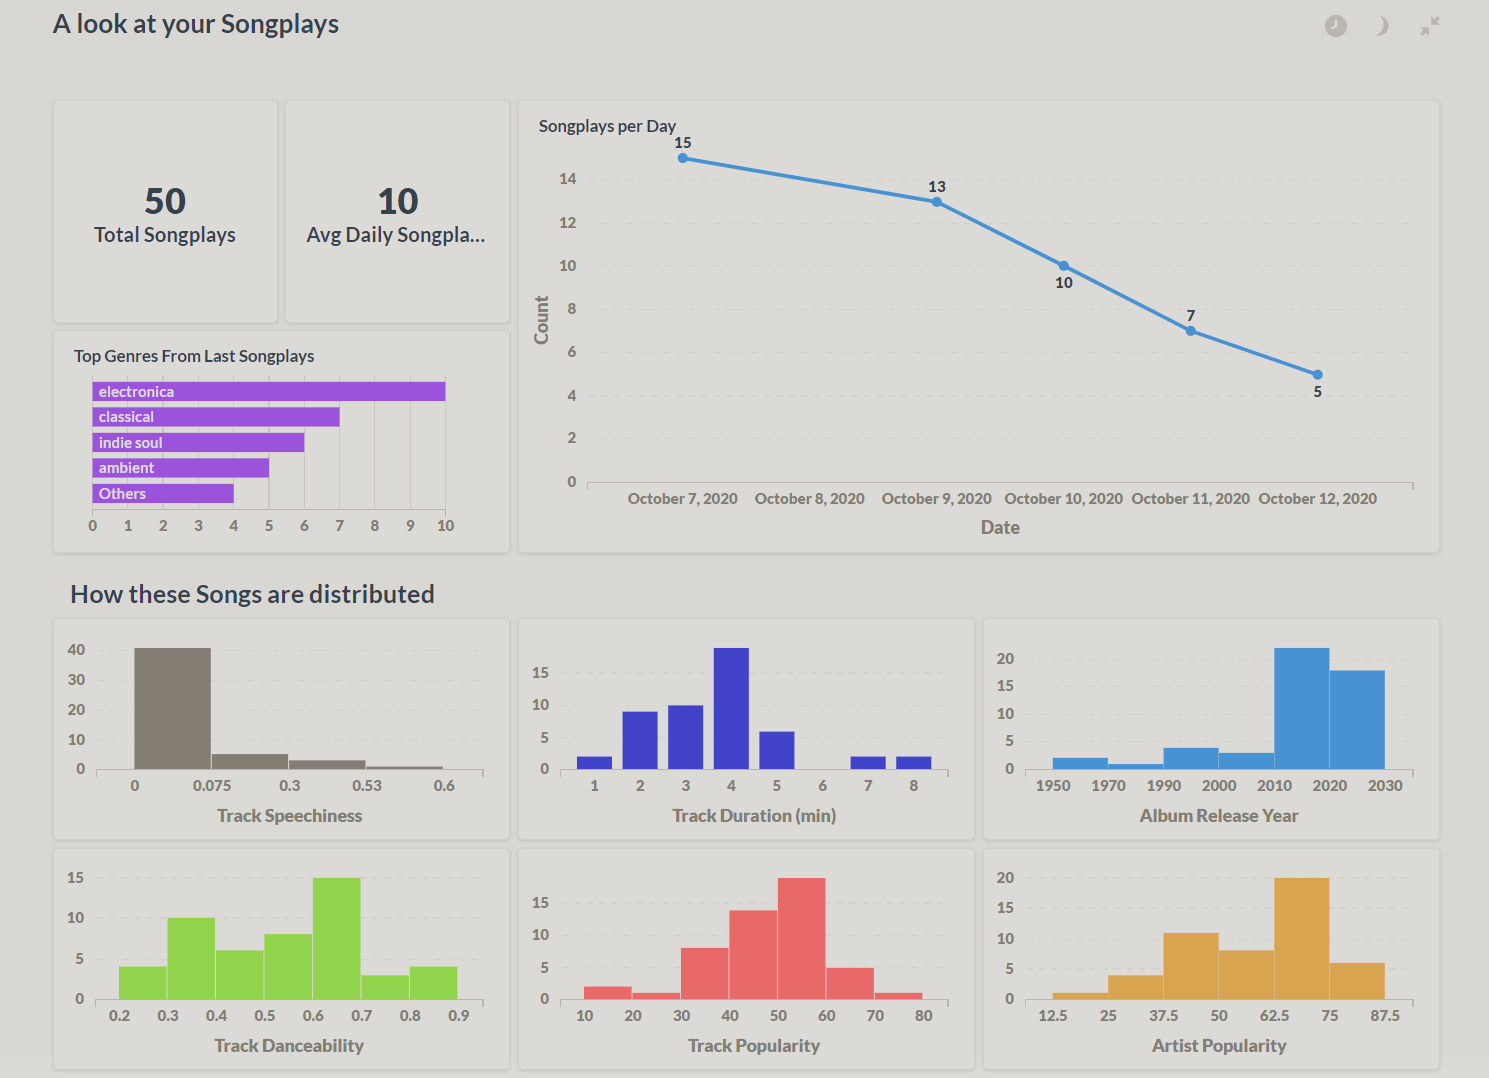
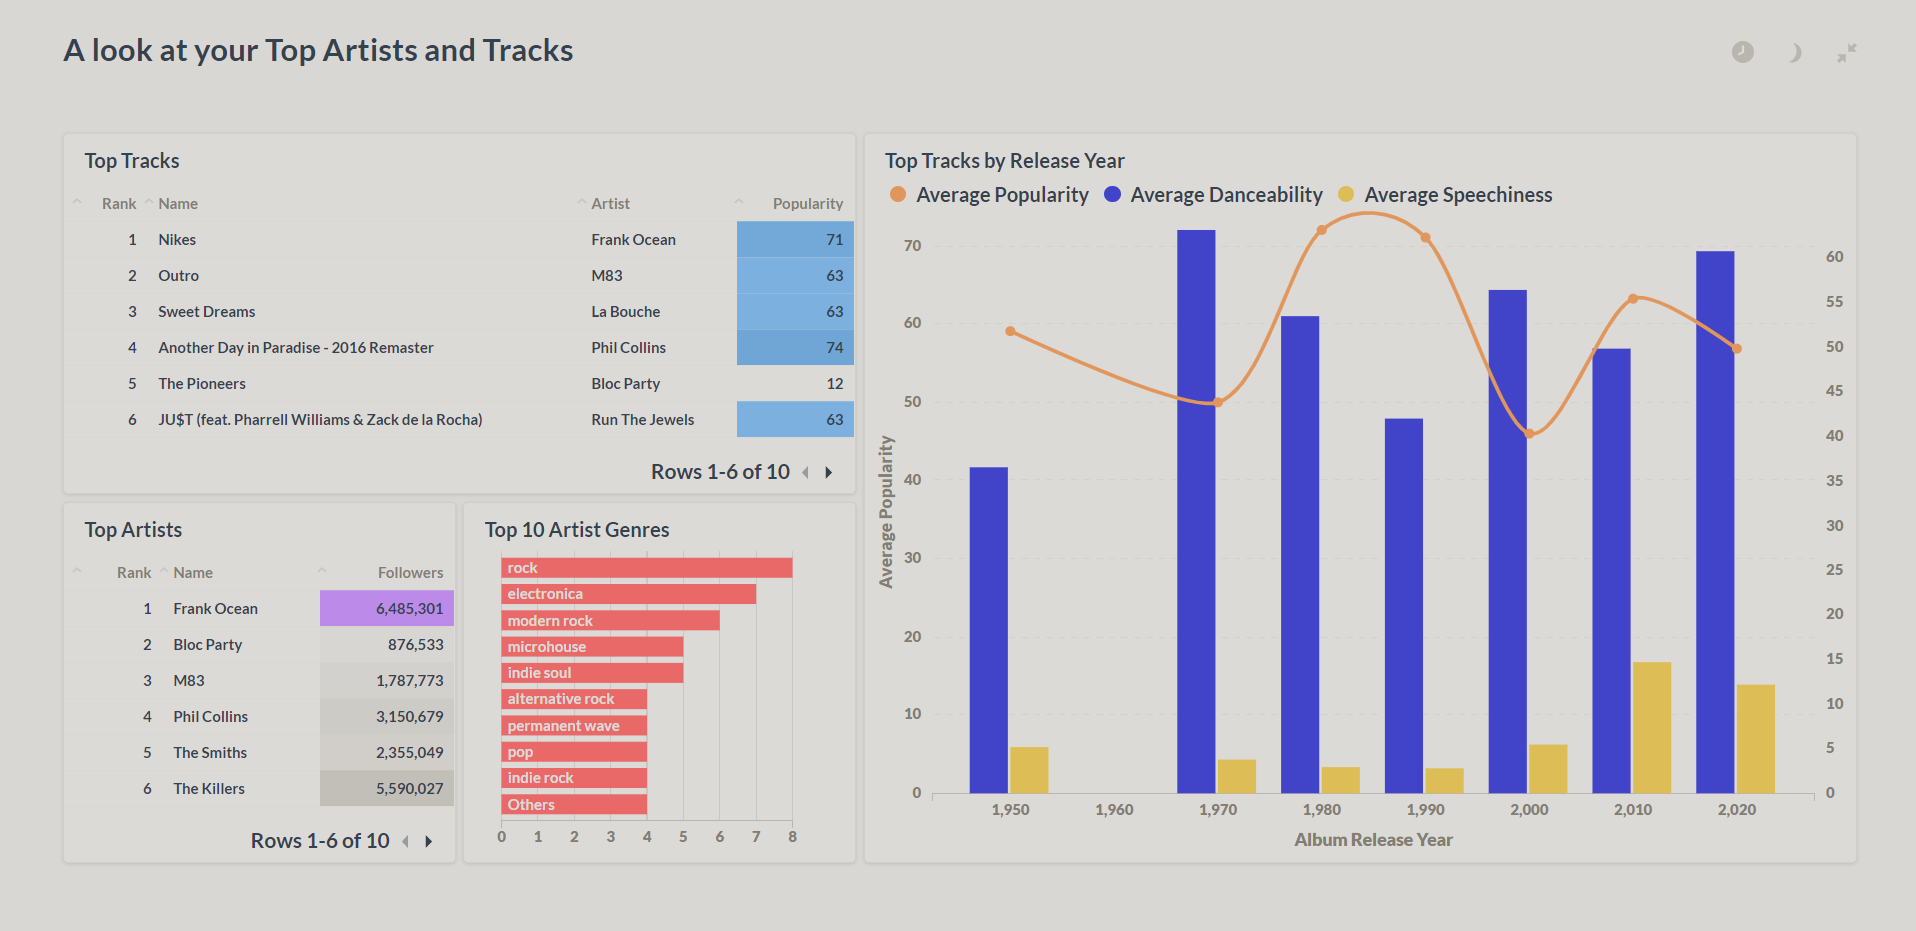
Then you can navigate through, play around, and analyze your data. Here are some sample screenshots of the dashboards