mmdetection_visualize_v1
It's a very simple version for visualizing the training result produced by mmdetection.
Readme
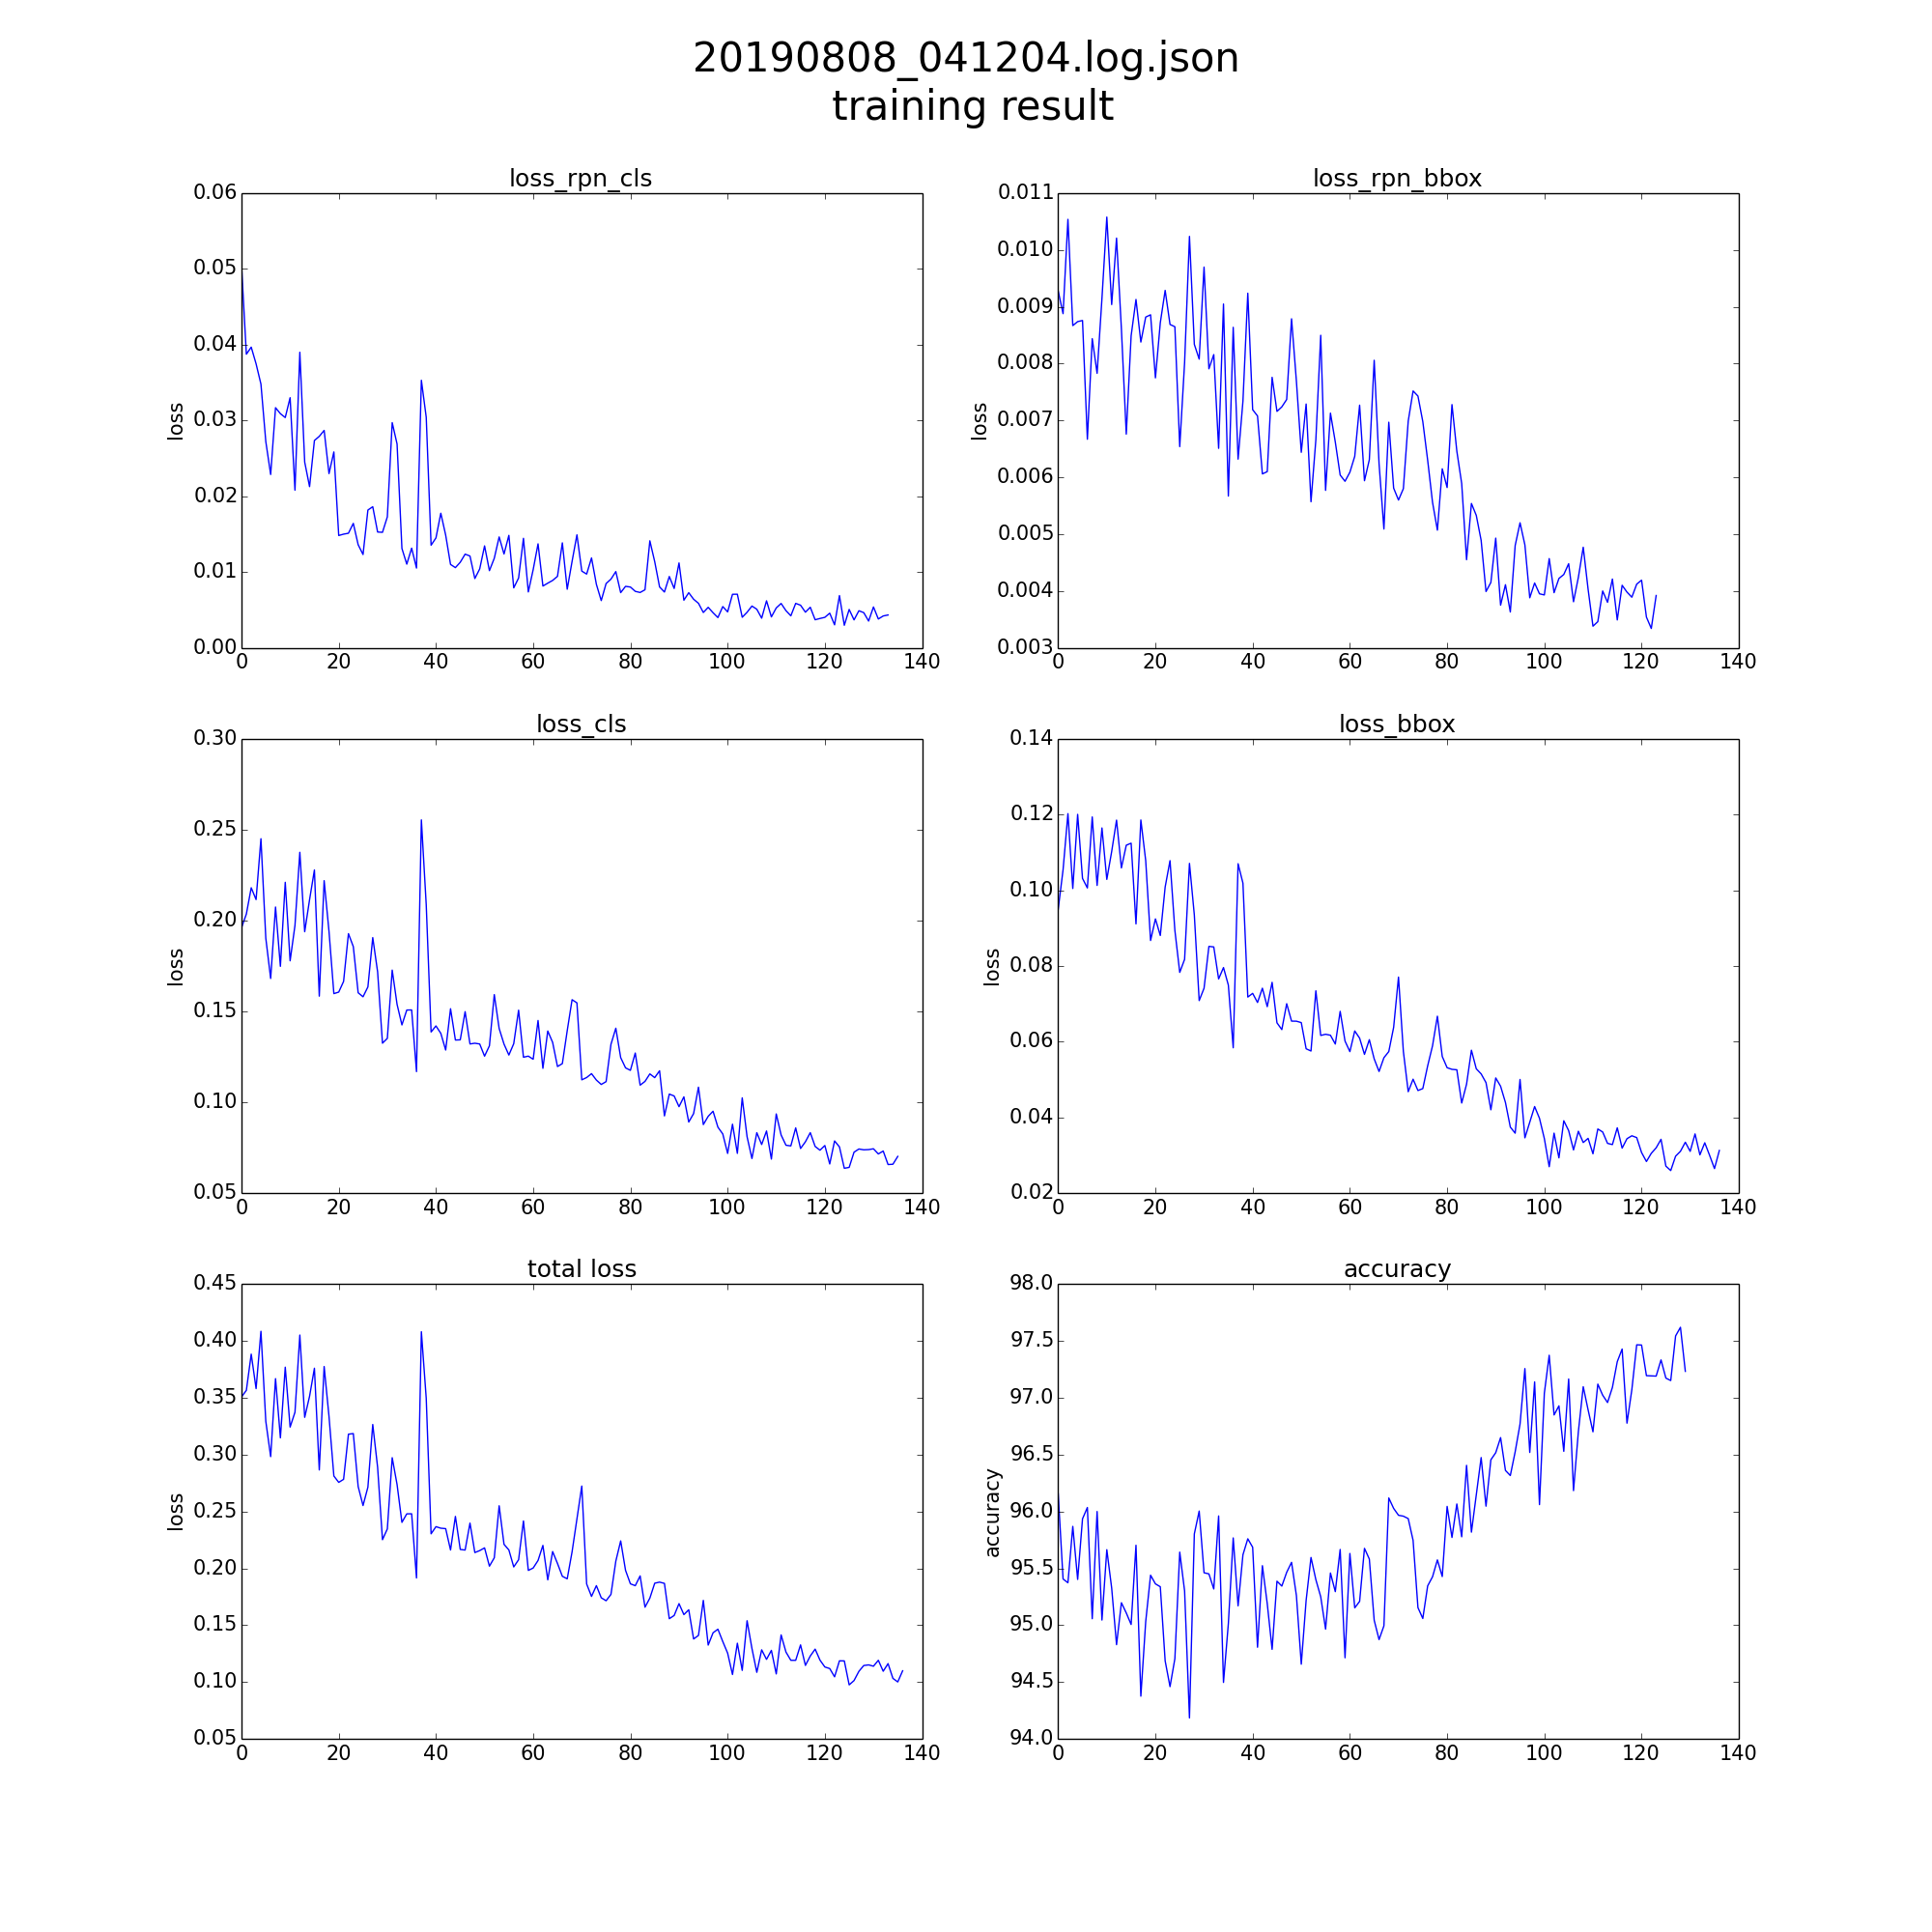
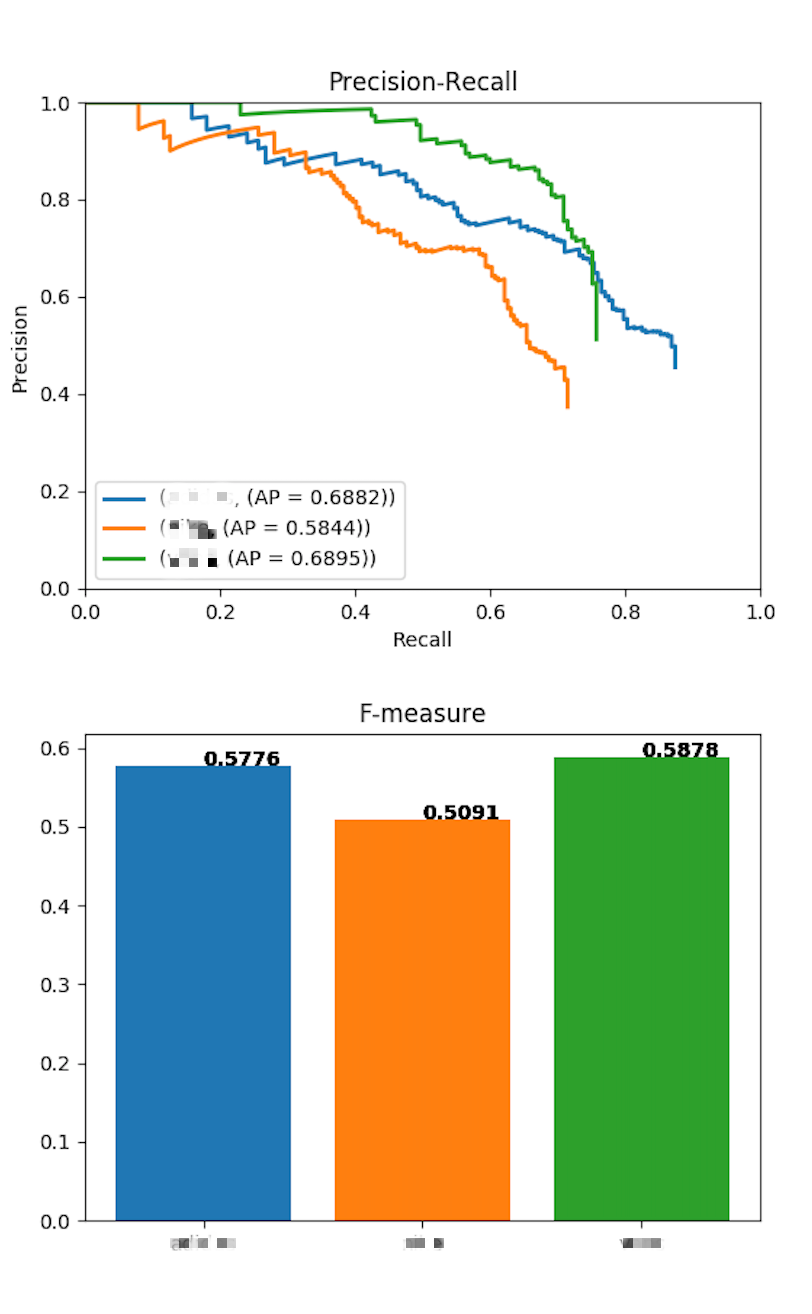
The program supports drawing six training result and the most important evaluation tool:PR curve(only for VOC now)
-
loss_rpn_bbox
-
loss_rpn_cls
-
loss_bbox
-
loss_cls
-
loss
-
acc
-
PR_curve
-
F-measure
Installation
- Clone it
git clone https://github.com/Stephenfang51/mmdetection_visualize
There will be total 5 files(json directory, output directory, visualize.py, mean_ap_visualize.py, voc_eval_visualize.py)
-
put
voc_eval_visualize.pyunder/mmdetection/tools/ -
put
mean_ap_visualize.pyundermmdetection/mmdet/core/evaluation/
How to use
six training result
- After training finished, you will have work_dir directory in your mmdetection directory
- take the latest json file and put into json directory in mmditection_visualize directory
- command
python visualize.py json/xxxxxxxlog.jsonin terminal - check the output directory, Done !
PR curve and F-measure
- make sure
voc_eval_visualize.pyandmean_ap_visualize.pysettled down - command as usual like
python tools/voc_eval_visualize.py {your pkl file} {your network configs file}- example
python tools/voc_eval_visualize.py result.pkl ./configs/faster_rcnn_r101_fpn_1x.py
- example
- check the /mmdetection main directory, you will see the PR_curve_each_class.png there, Done !