SAN Exporter
Prometheus exporter for Storage Area Network (SAN).
We all know that each SAN Storage vendor has their own glossary of terms, health/performance metrics and monitoring tool.
But from operator view,
- We normally focus on some main metrics which are similar on different storage platform.
- We are not only monitoring SAN storage but also other devices and services at multi-layer (application, virtual Machine, hypervisor, operating system and physical).
That's why we build this to have an unified monitoring/alerting solution with Prometheus and Alermanager.
Architecture overview

Features
There are some main features you might want to know, for others, please see [example configuration]https://raw.githubusercontent.com/vCloud-DFTBA/san_exporter/main/examples/config.yml.sample).
- Enable/disable optinal metrics for each backend
- Enable/disable backend
- Backend will automatically stop collecting data from SAN system after
timeoutseconds from last request of client. With this feature, we can deploy two instances as Active/Passive mode for high availability.
Note: Backend may not respond metrics in the first interval while collecting, calculating and caching metrics.
Quick start
- Start a dummy driver with Docker
$ git clone [email protected]:vCloud-DFTBA/san_exporter.git
$ cd san_exporter/
$ cp examples/dummy_config.yml config.yml
# docker run --rm -p 8888:8888 -v $(pwd)/config.yml:/san-exporter/config.yml --name san-exporter daikk115/san-exporter:0.1.0
See the result at http://localhost:8888/dummy_backend
- Start a dummy driver manually
$ git clone [email protected]:vCloud-DFTBA/san_exporter.git
$ cd san_exporter/
$ cp examples/dummy_config.yml config.yml
$ sudo apt-get install libxml2-dev libxslt1-dev python3.7-dev
$ pip3 install -r requirements.txt
$ python3.7 manage.py
See the result at http://localhost:8888/dummy_backend
Deployment
Create configuration file
# mkdir /root/san-exporter
# cp /path/to/san_exporter/examples/config.yml.sample /root/san-exporter/config.yml
Update /root/san-exporter/config.yml for corresponding to SAN storage
Run new container
# docker volume create san-exporter
# docker run -d -p 8888:8888 -v san-exporter:/var/log/ -v /root/san-exporter/config.yml:/san-exporter/config.yml --name san-exporter daikk115/san-exporter:latest
Supported Drivers
- Matrix of driver's generic metrics
| Capacity all | Capacity pool | IOPS/Throuhgput pool | Latency pool | IOPS/Throughput node | Latency node | CPU node | RAM node | IOPS/Throughput LUN | Latency LUN | IOPS/Throughput disk | Latency disk | IOPS/Throughput port | Latency port | Alert | |
|---|---|---|---|---|---|---|---|---|---|---|---|---|---|---|---|
| HPMSA | X | X | X | X | X | X | X | X | |||||||
| DellUnity | X | X | X | X | X | X | X | X | X | X | |||||
| HitachiG700 | X | X | X | ||||||||||||
| HPE3Par | X | X | X | X | X | X | X | X | |||||||
| NetApp | X | X | X | X | X | X | |||||||||
| SC8000 | X | X | X | X | X | X | X | X | X | X | X | ||||
| V7k | X | X | X | X | X | X |
- Connection port requirements
- For some SAN system, we collect metrics over SP API but some others, we collect metrics dirrectly from controller API.
- In some special cases, we collect alerts over SSH.
| SAN System | Service Processor | Connection Port |
|---|---|---|
| HPMSA | NO | 443 |
| Dell Unity | NO | 443 |
| Hitachi G700 | YES | 23451 |
| IBM V7000 | NO | #TODO |
| IBM V5000 | NO | #TODO |
| HPE 3PAR | YES | #TODO |
| NetApp ONTAP | NO | 443 |
| SC8000 | NO | 3033 |
Metrics
All metrics are prefixed with "san_" and has at least 2 labels: backend_name and san_ip
Info metrics:
| Metrics name | Type | Help |
|---|---|---|
| san_storage_info | gauge | Basic information: serial, version, ... |
Controller metrics:
| Metrics name | Type | Help |
|---|---|---|
| san_totalNodes | gauge | Total nodes |
| san_masterNodes | gauge | Master nodes |
| san_onlineNodes | gauge | Online nodes |
| san_compress_support | gauge | Compress support, 1 = Yes, 0 = No |
| san_thin_provision_support | gauge | Thin provision support, 1 = Yes, 0 = No |
| san_system_reporter_support | gauge | System reporter support, 1 = Yes, 0 = No |
| san_qos_support | gauge | QoS support, 1 = Yes, 0 = No |
| san_totalCapacityMiB | gauge | Total system capacity in MiB |
| san_allocatedCapacityMiB | gauge | Total allocated capacity in MiB |
| san_freeCapacityMiB | gauge | Total free capacity in MiB |
| san_cpu_system_utilization | gauge | The average percentage of time that the processors on nodes are busy doing system I/O tasks |
| san_cpu_compression_utilization | gauge | The approximate percentage of time that the processor core was busy with data compression tasks |
| san_cpu_total | gauge | The cpus spent in each mode |
Pool metrics:
| Metrics name | Type | Help |
|---|---|---|
| san_pool_totalLUNs | gauge | Total LUNs (or Volumes) |
| san_pool_total_capacity_mib | gauge | Total capacity of pool in MiB |
| san_pool_free_capacity_mib | gauge | Free of pool in MiB |
| san_pool_provisioned_capacity_mib | gauge | Provisioned of pool in MiB |
| san_pool_number_read_io | gauge | Read I/O Rate - ops/s |
| san_pool_number_write_io | gauge | Write I/O Rate - ops/s |
| san_pool_read_cache_hit | gauge | Read Cache Hits - % |
| san_pool_write_cache_hit | gauge | Write Cache Hits - % |
| san_pool_read_kb gauge | gauge | Read Data Rate - KiB/s |
| san_pool_write_kb | gauge | Write Data Rate - KiB/s |
| san_pool_read_service_time_ms | gauge | Read Response Time - ms/op |
| san_pool_write_service_time_ms | gauge | Write Response Time - ms/op |
| san_pool_read_IOSize_kb | gauge | Read Transfer Size - KiB/op |
| san_pool_write_IOSize_kb | gauge | Write Transfer Size - KiB/op |
| san_pool_queue_length | gauge | Queue length of pool |
Port metrics:
| Metrics name | Type | Help |
|---|---|---|
| san_port_number_read_io | gauge | Port Read I/O Rate - ops/s |
| san_port_number_write_io | gauge | Port Write I/O Rate - ops/s |
| san_port_write_kb | gauge | Port Write Data Rate - KiB/s |
| san_port_read_kb | gauge | Port Read Data Rate - KiB/s |
| san_port_write_IOSize_kb | gauge | Port Write Transfer Size - KiB/op |
| san_port_read_IOSize_kb | gauge | Port Read Transfer Size - KiB/op |
| san_port_queue_length | gauge | Queue length of port |
For more information about specific metrics of SANs, see Specific SAN Metrics
Integrate with Prometheus, Alertmanager and Grafana
- [Example prometheus alert rules]https://raw.githubusercontent.com/vCloud-DFTBA/san_exporter/main/examples/rules)
- [Example grafana dashboard]https://raw.githubusercontent.com/vCloud-DFTBA/san_exporter/main/examples/dashboards)
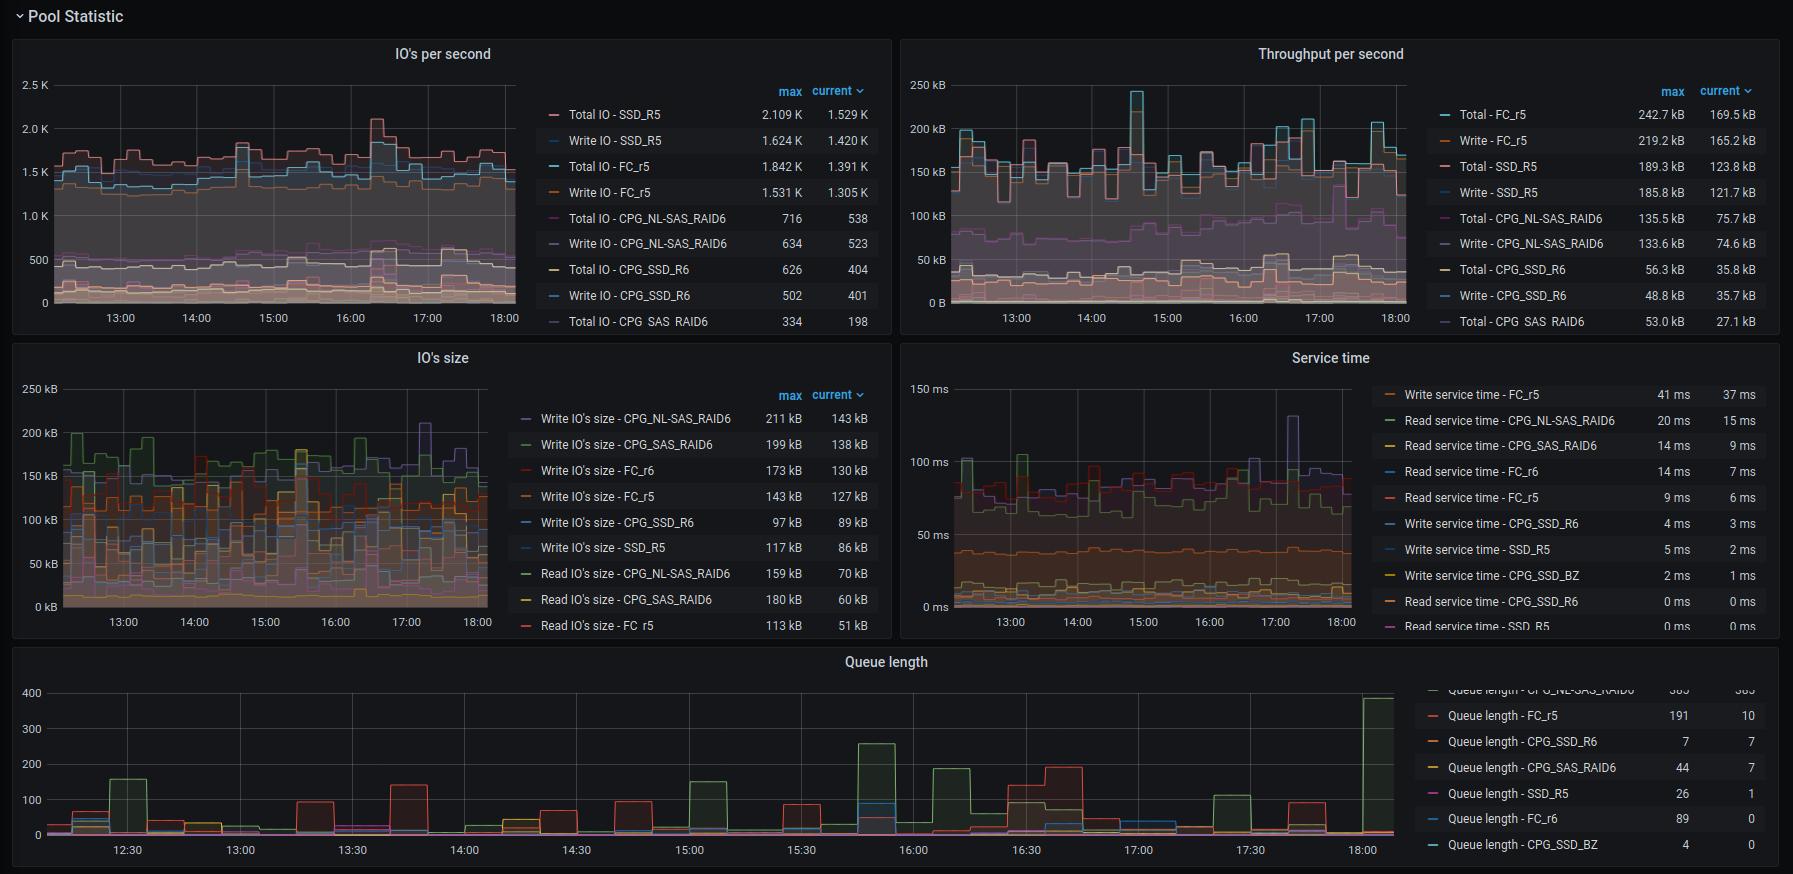
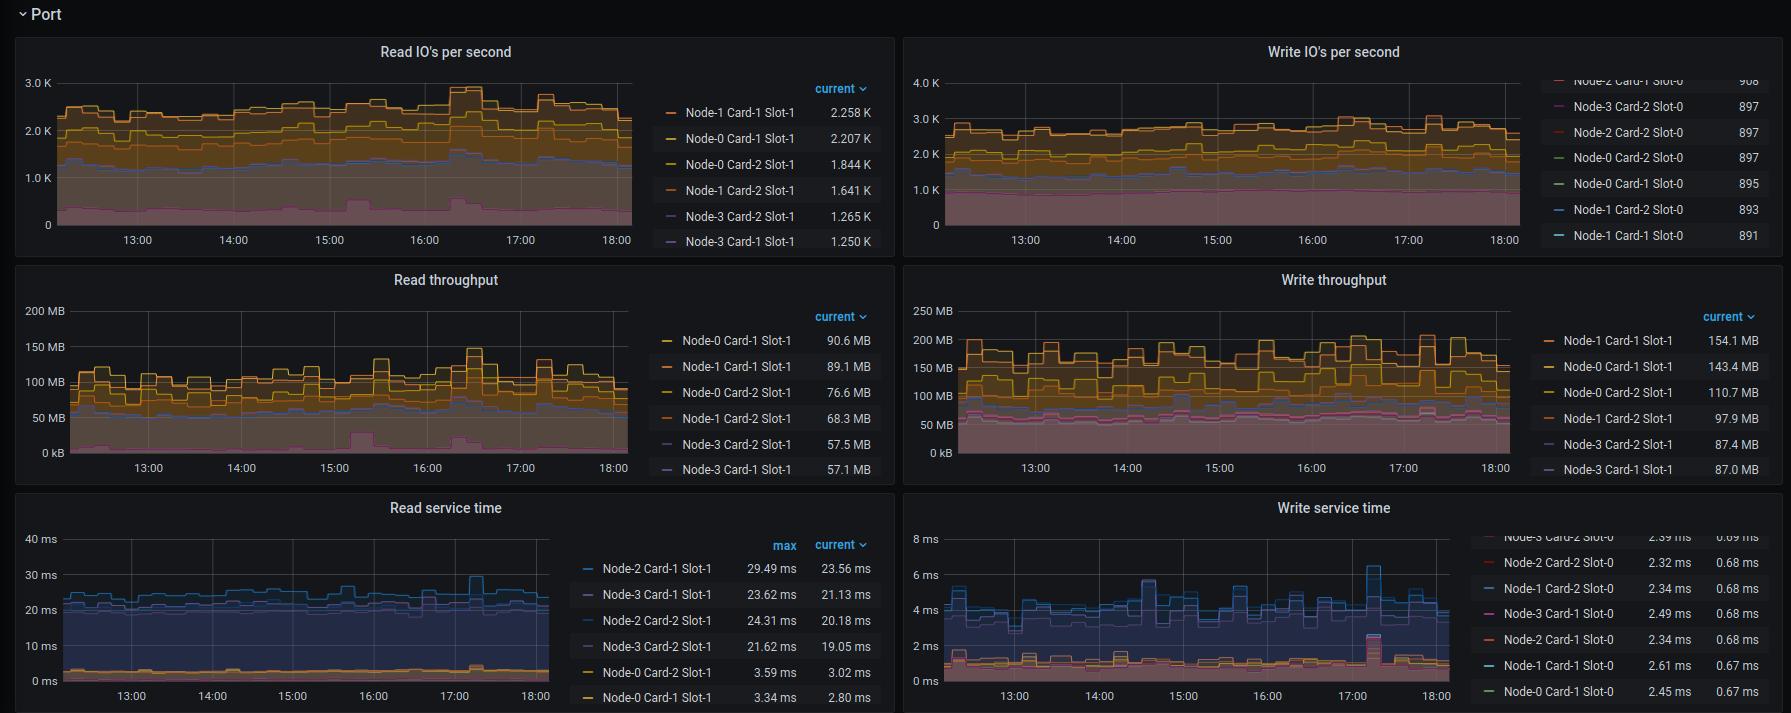
Some grafana images:
![SAN exporter dashboard overview]https://raw.githubusercontent.com/vCloud-DFTBA/san_exporter/main/examples/dashboards/images/san-overview.jpg)
![SAN exporter dashboard pool]https://raw.githubusercontent.com/vCloud-DFTBA/san_exporter/main/examples/dashboards/images/san-pool.jpg)
![SAN exporter dashboard port]https://raw.githubusercontent.com/vCloud-DFTBA/san_exporter/main/examples/dashboards/images/san-port.jpg)


