Self-Supervised Music Analysis
Self-Supervised Contrastive Learning of Music Spectrograms.
Dataset
Songs on the Billboard Year End Hot 100 were collected from the years 1960-2020. This list tracks the top songs of the US market for a given calendar year based on aggregating metrics including streaming plays, physical and digital purchases, radio plays, etc. In total the dataset includes 5737 songs, excluding some songs which could not be found and some which are duplicates across multiple years. It’s worth noting that the types of songs that are able to make it onto this sort of list represent a very narrow subset of the overall variety of the US music market, let alone the global music market. So while we can still learn some interesting things from this dataset, we shouldn’t mistake it for being representative of music in general.
Raw audio files were processed into spectrograms using a synchrosqueeze CWT algorithm from the ssqueezepy python library. Some additional cleaning and postprocessing was done and the spectrograms were saved as grayscale images. These images are structured so that the Y axis which spans 256 pixels represents a range of frequencies from 30Hz – 12kHz with a log scale. The X axis represents time with a resolution of 200 pixels per second. Pixel intensity therefore encodes the signal energy at a particular frequency at a moment in time.
The full dataset can be found here:
https://www.kaggle.com/tpapp157/billboard-hot-100-19602020-spectrograms
Model and Training
A 30 layer ResNet styled CNN architecture was used as the primary feature extraction network. This was augmented with learned position embeddings along the frequency axis inserted at regular block intervals. Features were learned in a completely self-supervised fashion using Contrastive Learning. Matched pairs were taken as random 256x1024 pixel crops (corresponding to ~5 seconds of audio) from each song with no additional augmentations.
Output feature vectors have 512 channels representing a 64 pixel span (~0.3 seconds of audio).
Results
The entirety of each song was processed via the feature extractor with the resulting song matrix averaged across the song length into a single vector. UMAP is used for visualization and HDBSCAN for cluster extraction producing the following plot:
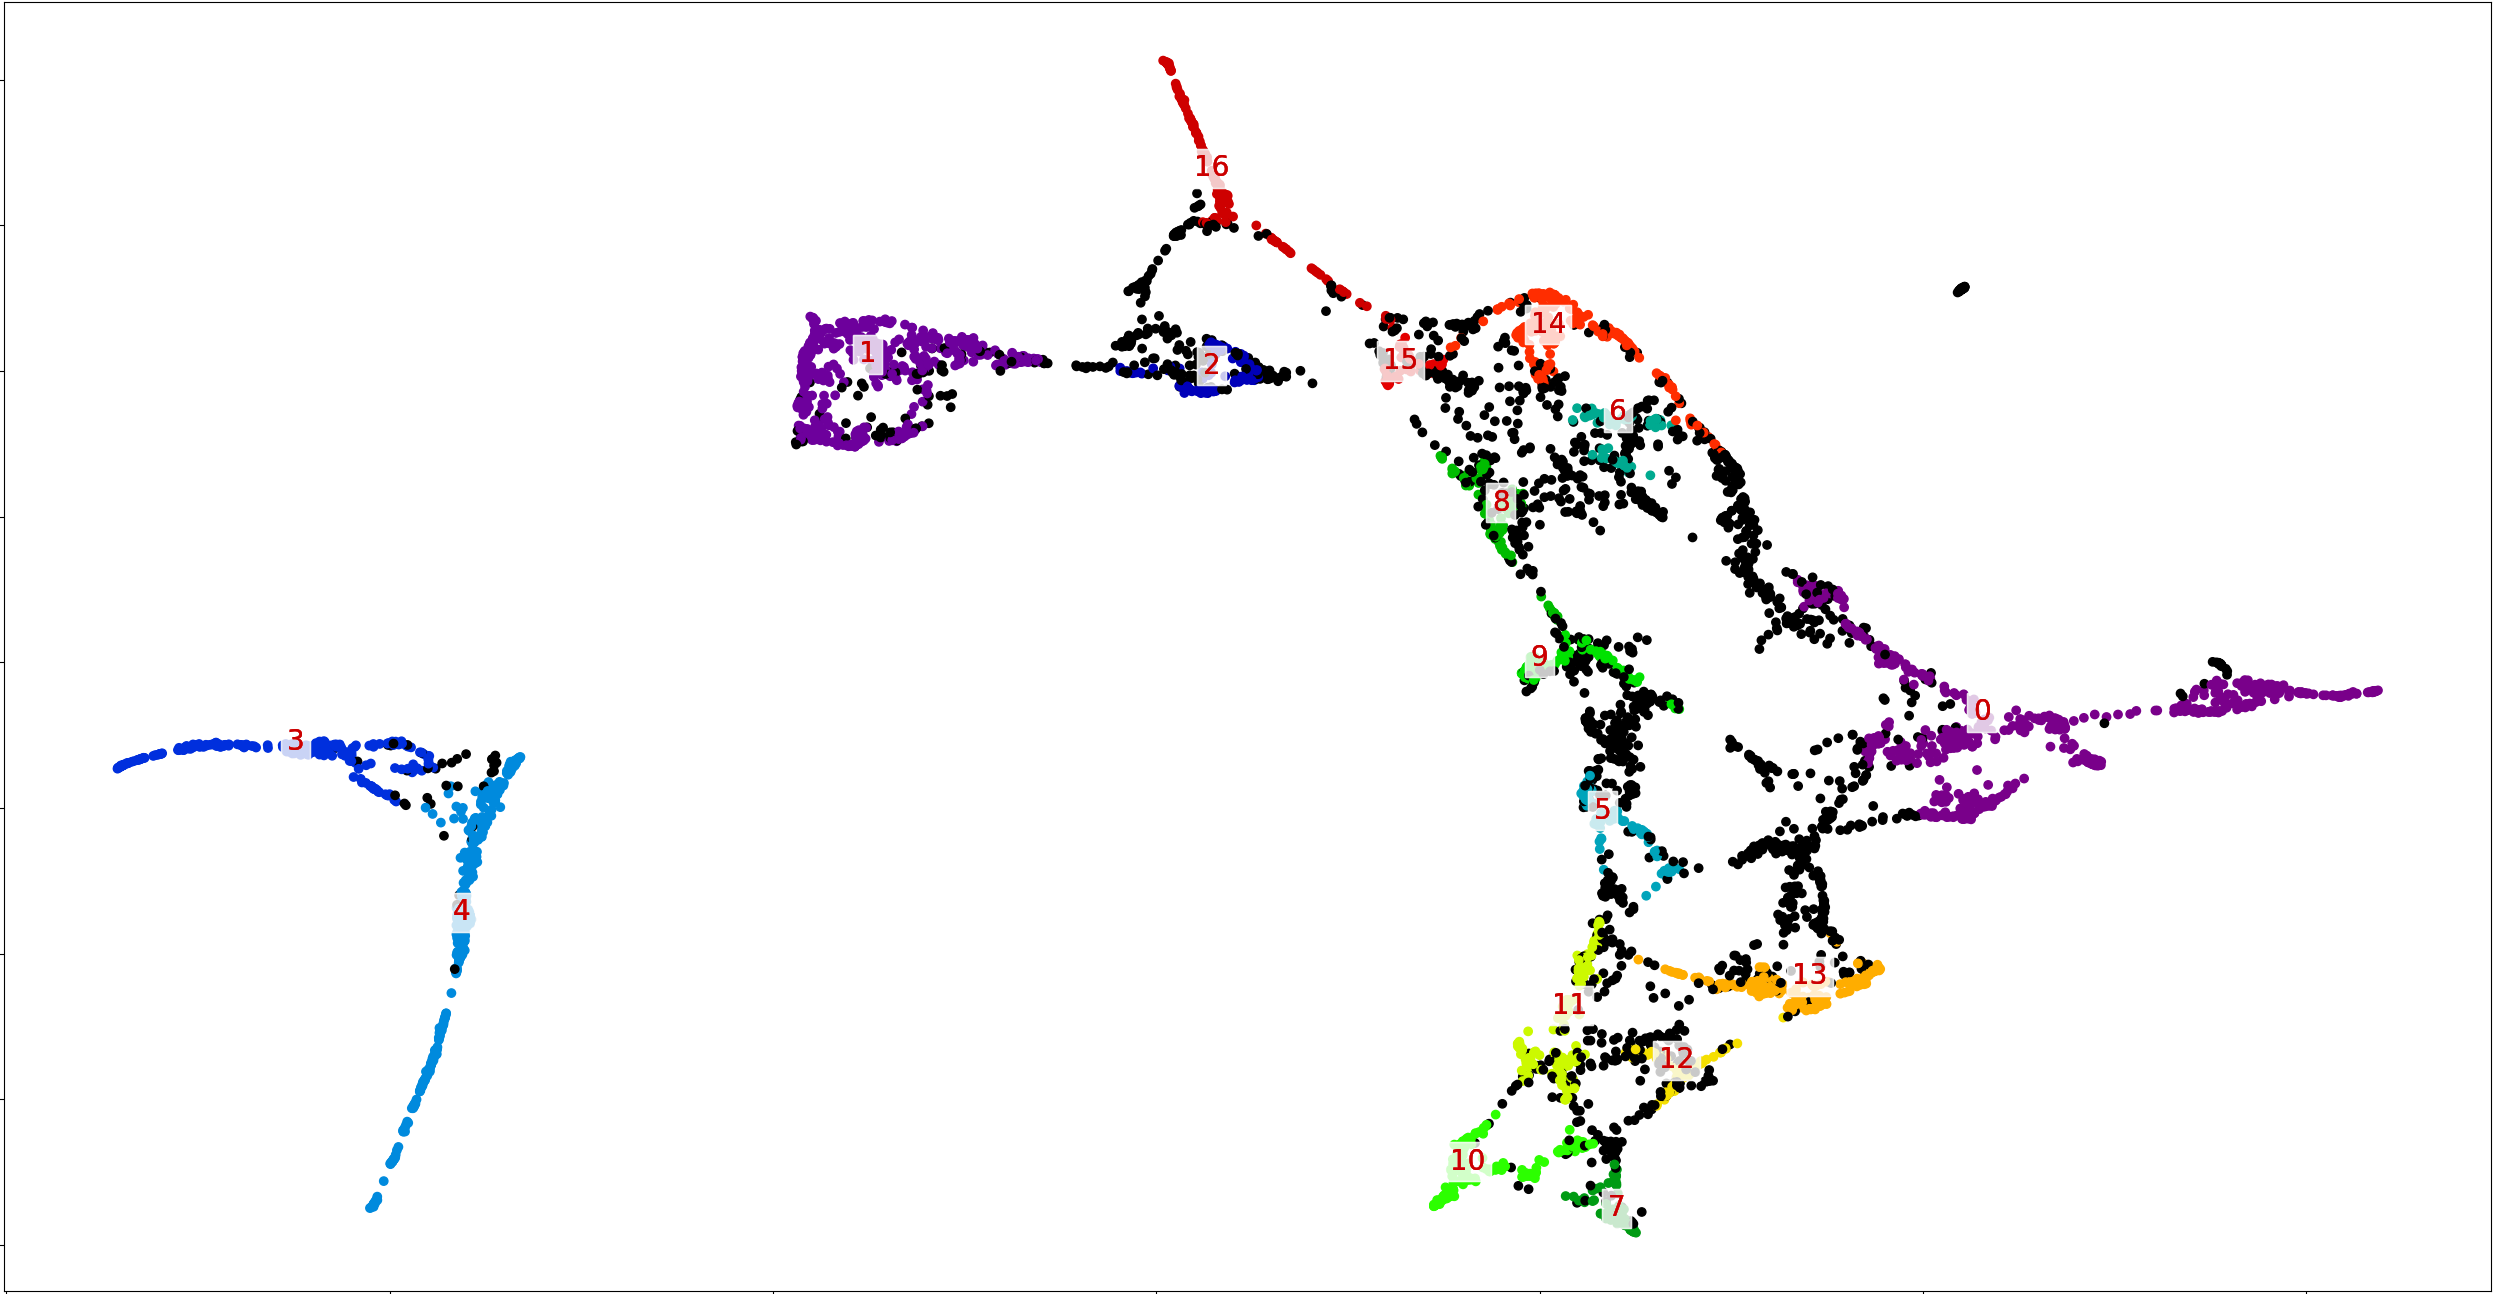
Each color represents a cluster (numbered 0-16) of similar songs based on the learned features. Immediately we can see a very clear structure in the data, showing the meaningful features have been learned. We can also color the points by year of release:
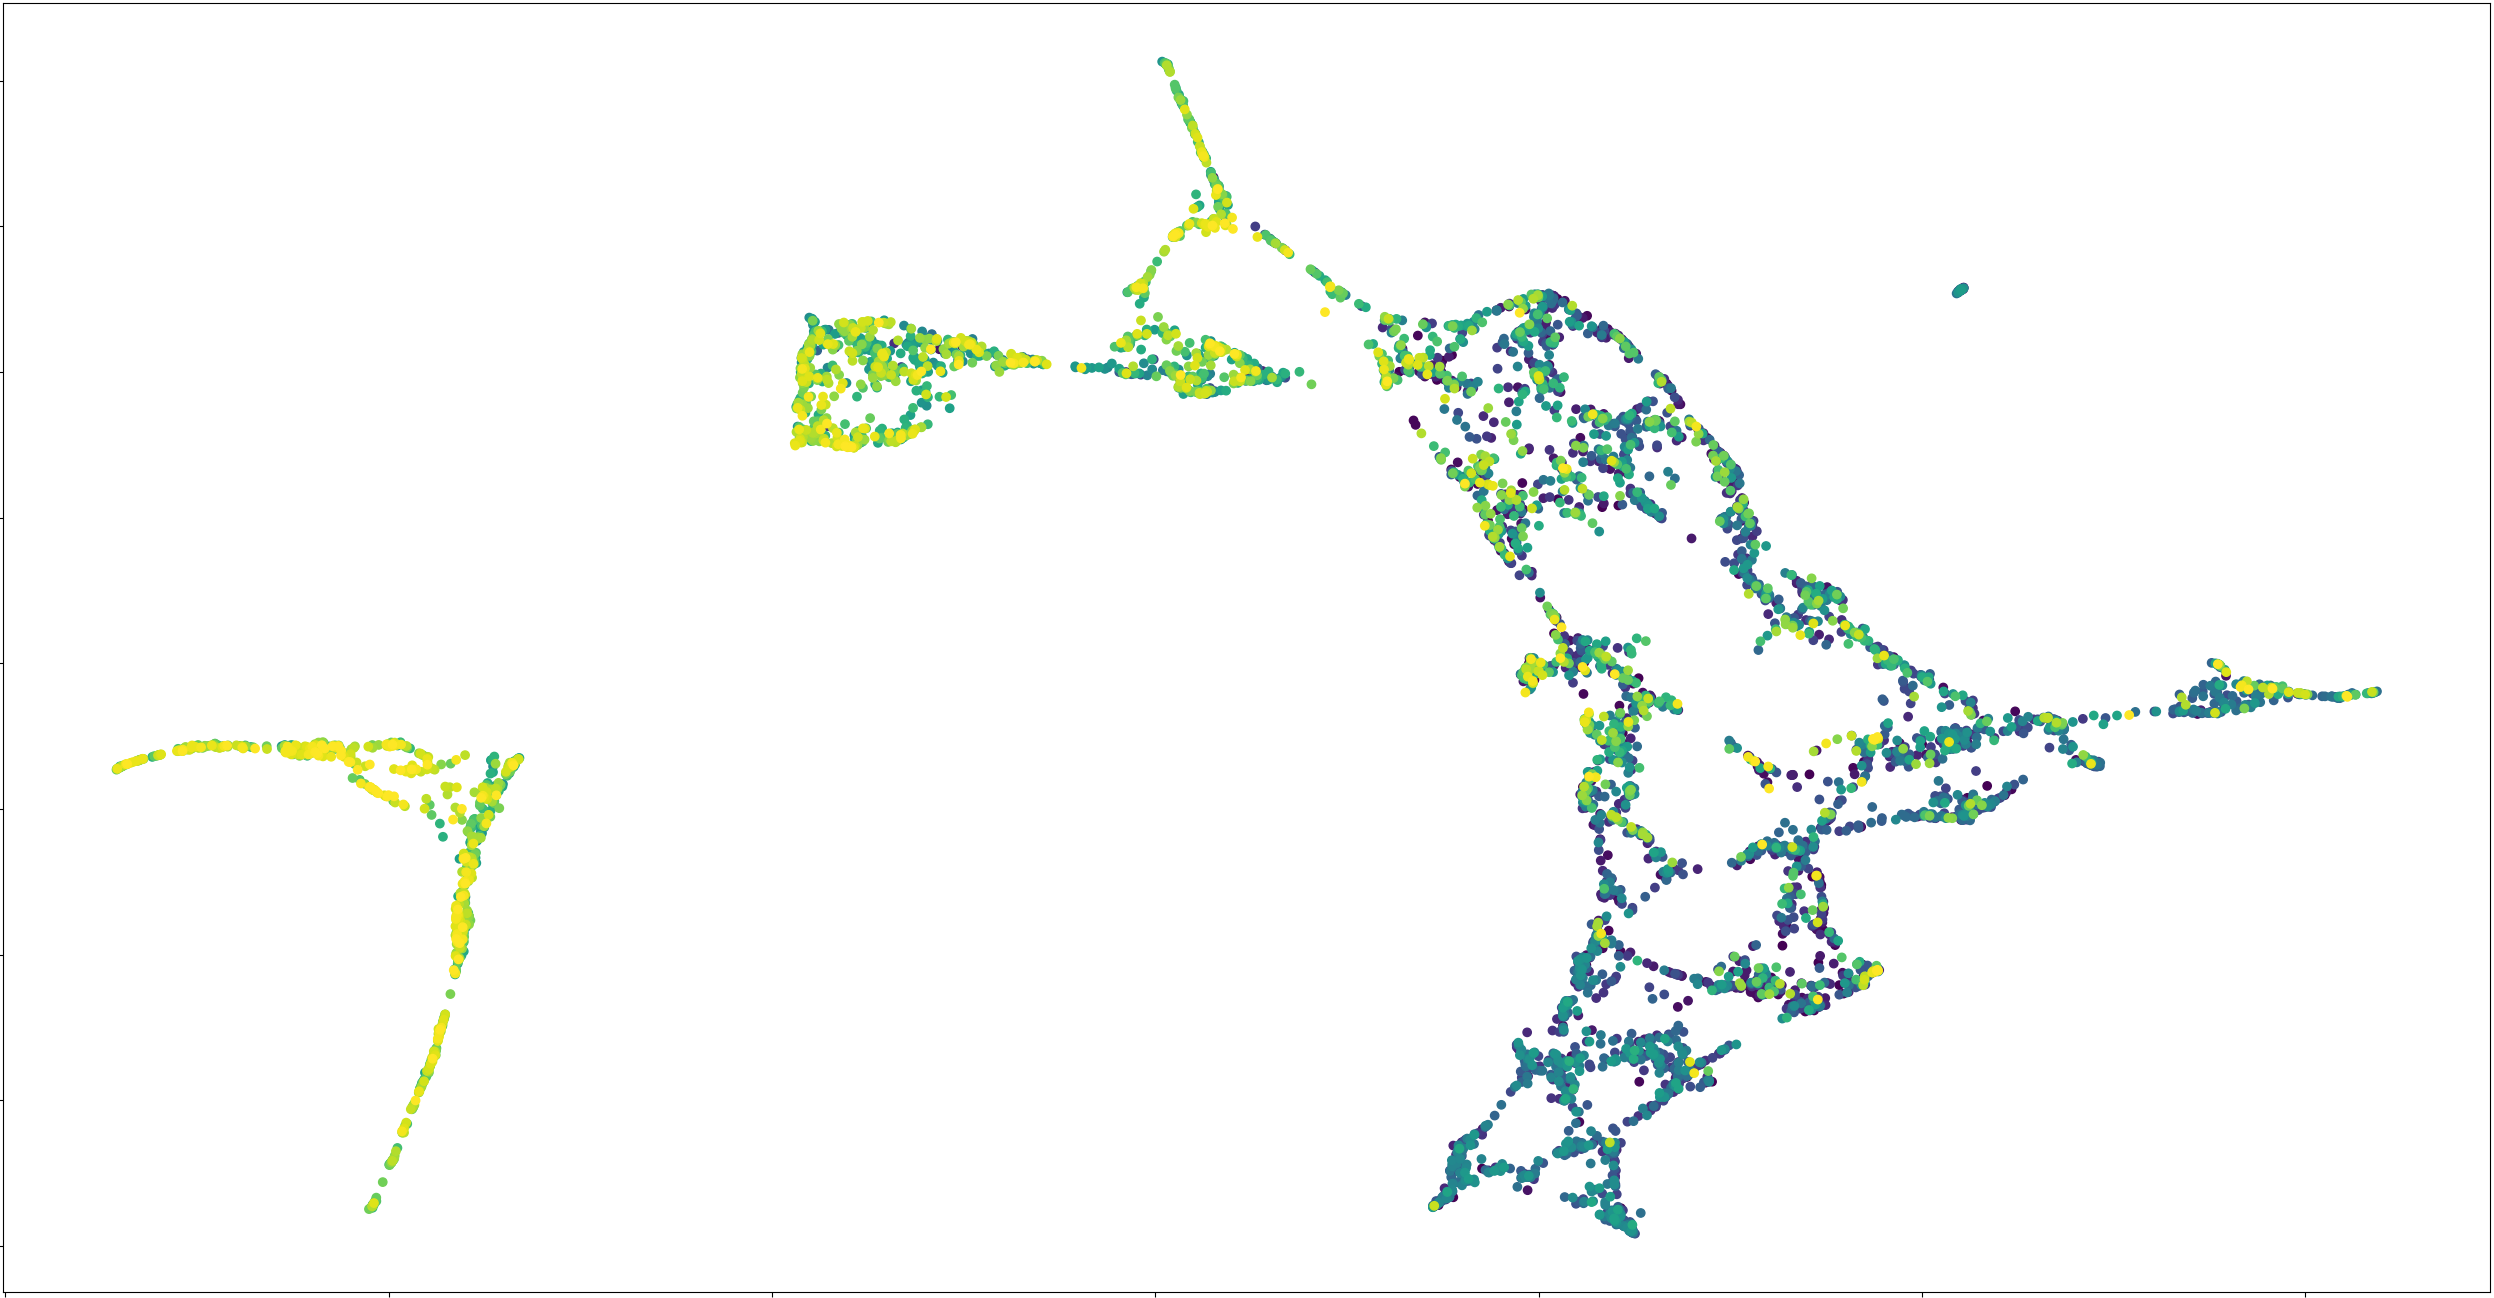
Points are colored form oldest (dark) to newest (light). As expected, the distribution of music has changed over the last 60 years. This gives us some confidence that the learned features are meaningful but let’s try a more specific test. A gradient boosting regressor model is trained on the learned features to predict the release year of a song.
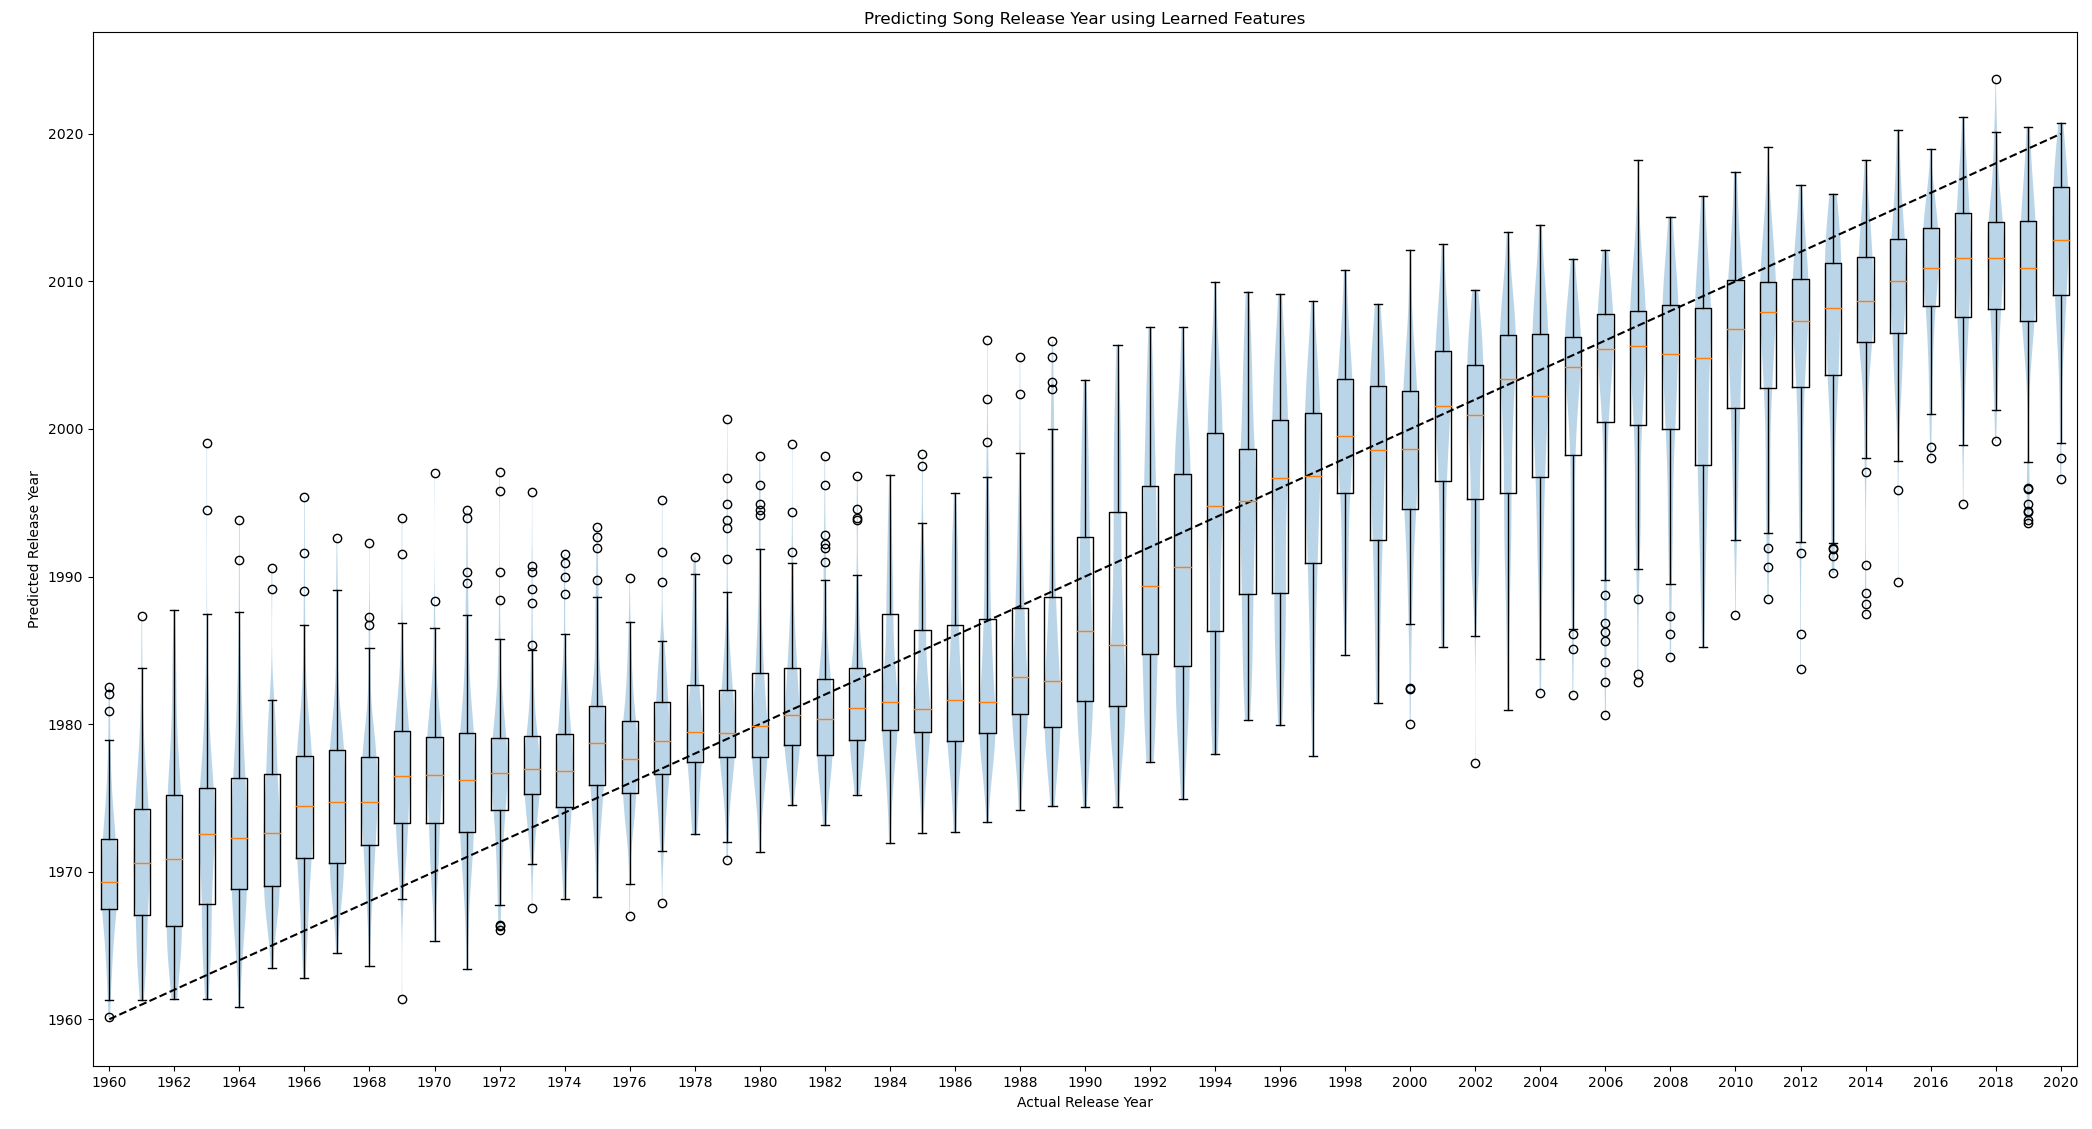
The model achieves an overall mean absolute error of ~6.2 years. The violin and box plots show the distribution of predictions for songs in each year. This result is surprisingly good considering we wouldn’t expect a model get anywhere near perfect. The plot shows some interesting trends in how the predicted median and overall variance shift from year to year. Notice, for example, the high variance and rapid median shift across the years 1990 to 2000 compared to the decades before and after. This hints at some potential significant changes in the structure of music during this decade. Those with a knowledge of modern musical history probably already have some ideas in mind. Again, it’s worth noting that this dataset represents generically popular music which we would expect to lag behind specific music trends (probably by as much as 5-10 years).
Let’s bring back the 17 clusters that were identified previously and look at the distribution of release years of songs in each cluster. The black grouping labeled -1 captures songs which were not strongly allocated to any particular cluster and is simply included for completeness.
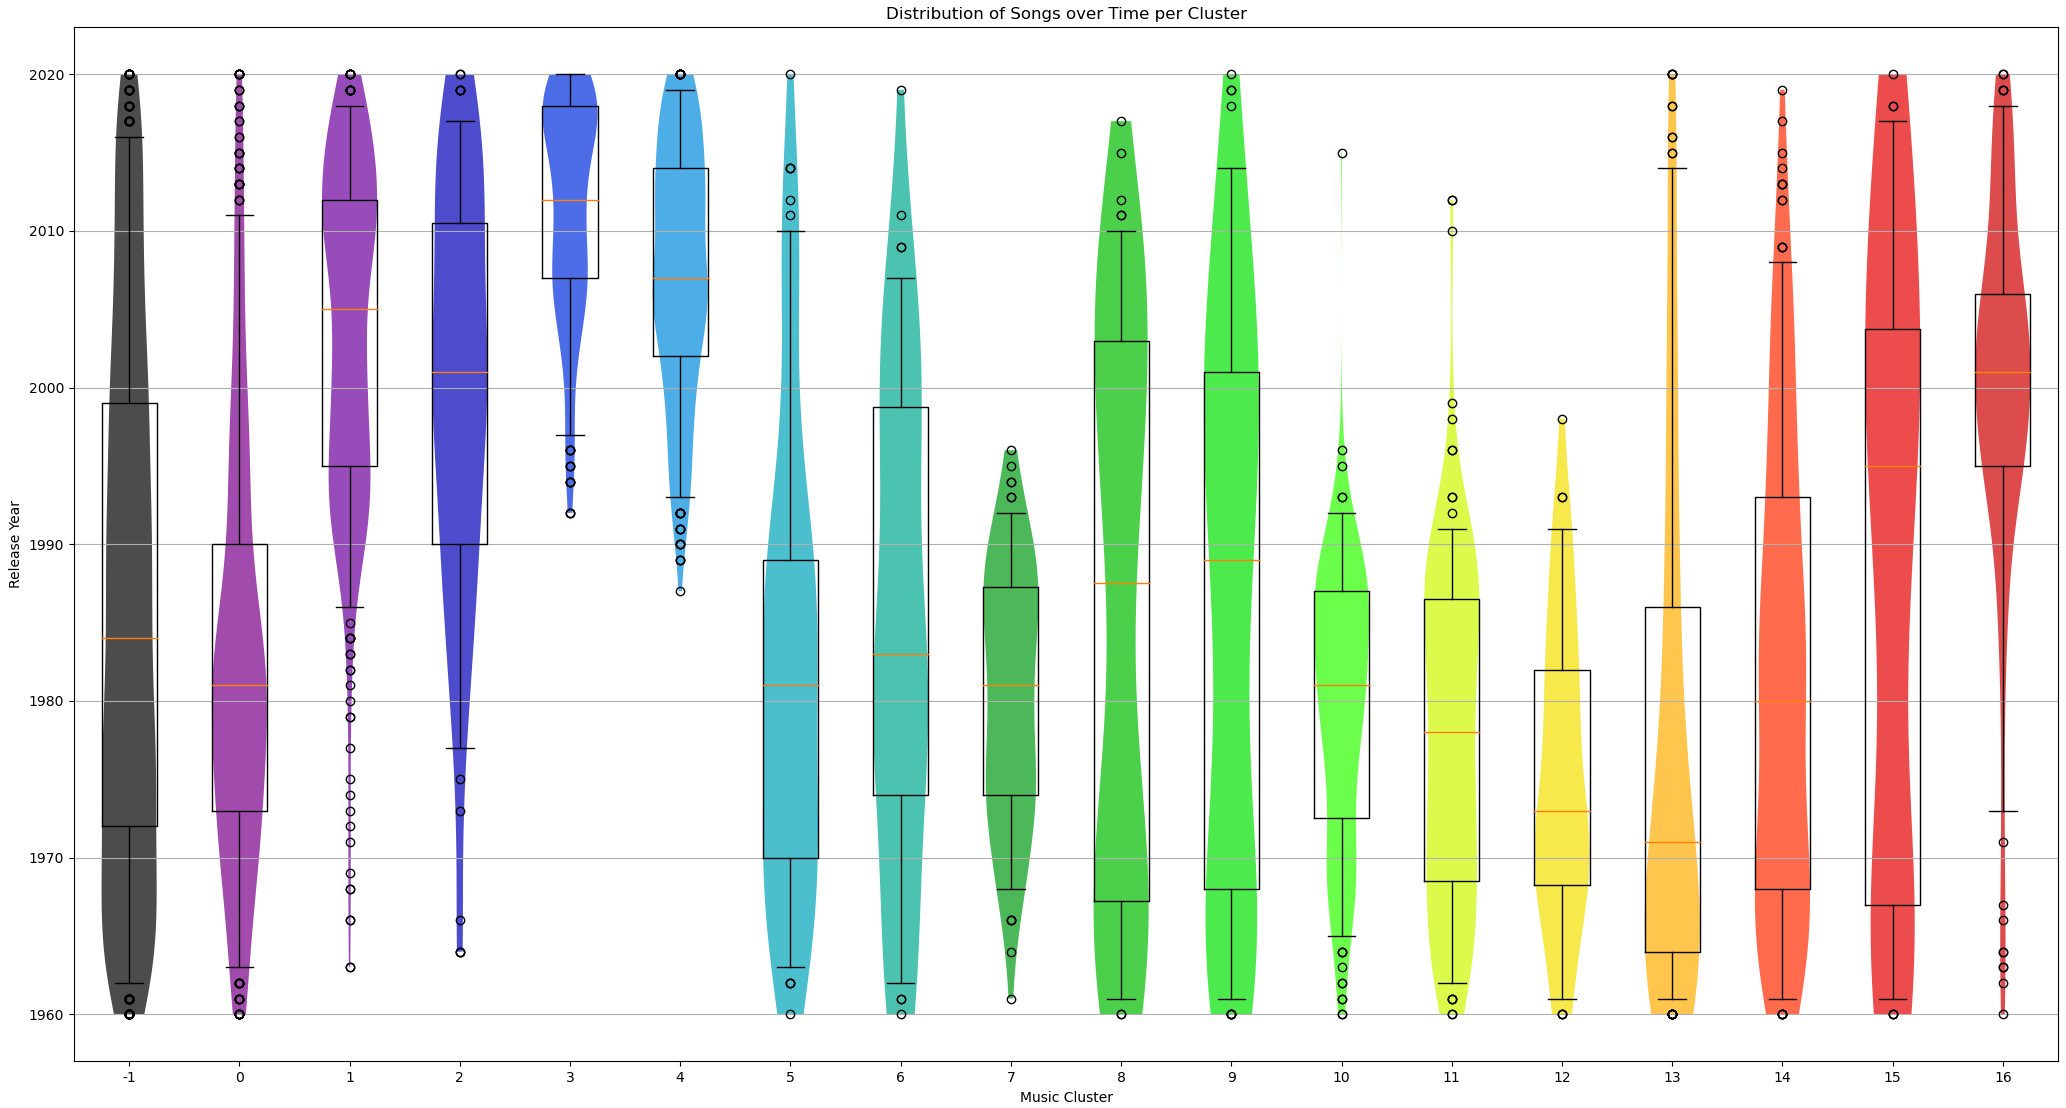
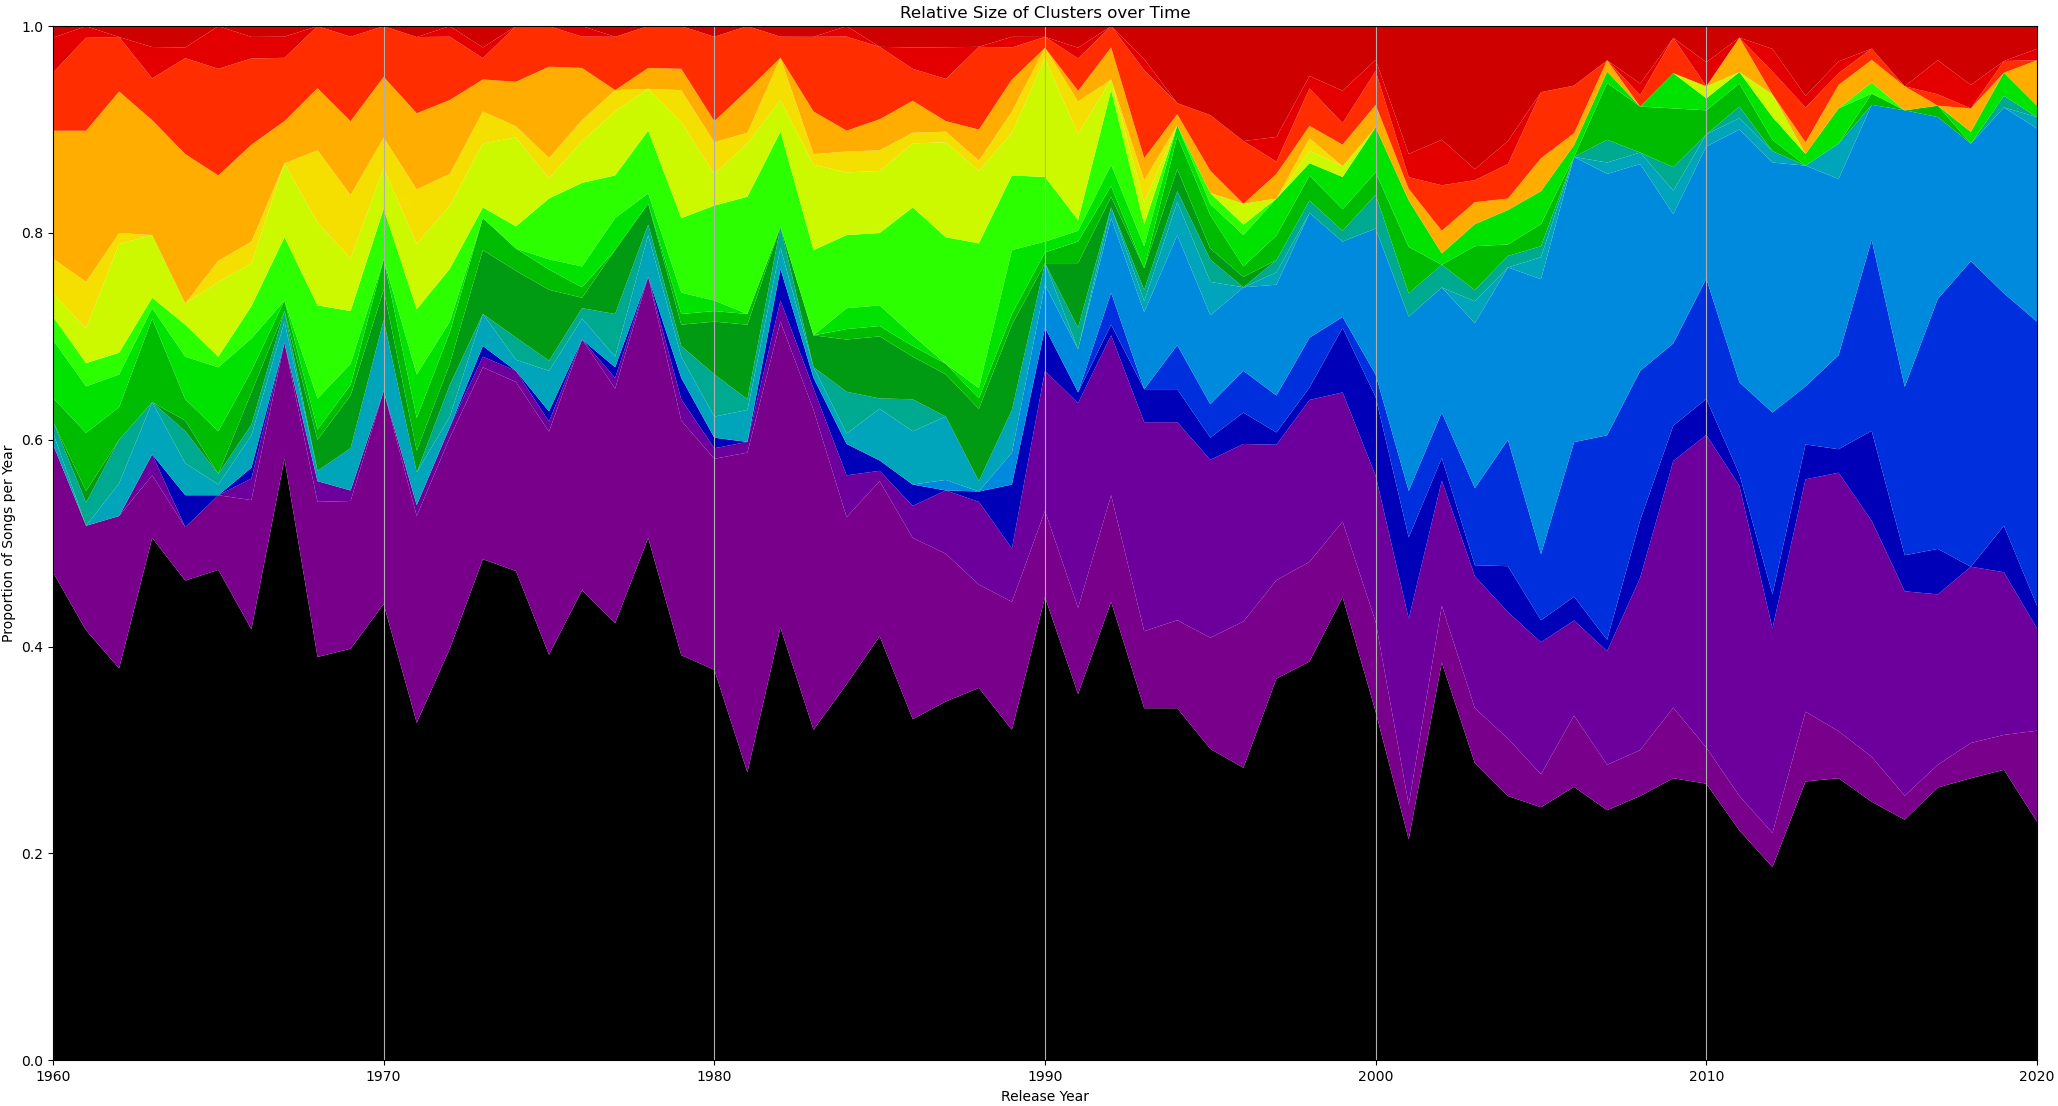
Here again we see some interesting trends of clusters emerging, peaking, and even dying out at various points in time. Aligning with out previous chart, we see four distinct clusters (7, 10, 11, 12) die off in the 90s while two brand new clusters (3, 4) emerge. Other clusters (8, 9, 15), interestingly, span most or all of the time range.
We can also look at the relative allocation of songs to clusters by year to get a better sense of the overall size of each cluster.
Cluster Samples
So what exactly are these clusters? I’ve provided links below to ten representative songs from each cluster so you can make your own qualitative evaluation. Before going further and listening to these songs I want to encourage you loosen your preconceived notions of musical genre. Popular conception of musical genres typically includes non-musical aspects like lyrics, theme, particular instruments, artist demographics, singer accent, year of release, marketing, etc. These aspects are not captured in the dataset and therefore not represented below but with an open ear you may find examples of songs that you considered to be different genres are actually quite musically similar.


